Program started on Fri, Jul 22 2005 at 4:03 AM.
Analyzed requests from Thu, Jul 21 2005 at 4:07 AM to Fri, Jul 22 2005 at 4:02 AM (1.00 days).
(Go To: Top | General Summary | Monthly Report | Weekly Report | Daily Report | Daily Summary | Hourly Summary | Domain Report | Organization Report | Host Report | Search Word Report | Operating System Report | Status Code Report | File Size Report | File Type Report | Directory Report | Failure Report | Request Report)
This report contains overall statistics.
Successful requests: 2,958
Average successful requests per day: 2,967
Successful requests for pages: 848
Average successful requests for pages per day: 849
Failed requests: 240
Redirected requests: 18
Distinct files requested: 671
Distinct hosts served: 356
Corrupt logfile lines: 121
Unwanted logfile entries: 13,848
Data transferred: 192.73 megabytes
Average data transferred per day: 193.41 megabytes
(Go To: Top | General Summary | Monthly Report | Weekly Report | Daily Report | Daily Summary | Hourly Summary | Domain Report | Organization Report | Host Report | Search Word Report | Operating System Report | Status Code Report | File Size Report | File Type Report | Directory Report | Failure Report | Request Report)
This report lists the activity in each month.
Each unit () represents 25 requests for pages or part thereof.
month | #reqs | #pages | |
---|---|---|---|
Jul 2005 | 2958 | 848 |
Busiest month: Jul 2005 (848 requests for pages).
(Go To: Top | General Summary | Monthly Report | Weekly Report | Daily Report | Daily Summary | Hourly Summary | Domain Report | Organization Report | Host Report | Search Word Report | Operating System Report | Status Code Report | File Size Report | File Type Report | Directory Report | Failure Report | Request Report)
This report lists the activity in each week.
Each unit () represents 25 requests for pages or part thereof.
week beg. | #reqs | #pages | |
---|---|---|---|
Jul/17/05 | 2958 | 848 |
Busiest week: week beginning Jul/17/05 (848 requests for pages).
(Go To: Top | General Summary | Monthly Report | Weekly Report | Daily Report | Daily Summary | Hourly Summary | Domain Report | Organization Report | Host Report | Search Word Report | Operating System Report | Status Code Report | File Size Report | File Type Report | Directory Report | Failure Report | Request Report)
This report lists the activity in each day.
Each unit () represents 20 requests for pages or part thereof.
date | #reqs | #pages | |
---|---|---|---|
Jul/21/05 | 2483 | 700 | |
Jul/22/05 | 475 | 148 |
Busiest day: Jul/21/05 (700 requests for pages).
(Go To: Top | General Summary | Monthly Report | Weekly Report | Daily Report | Daily Summary | Hourly Summary | Domain Report | Organization Report | Host Report | Search Word Report | Operating System Report | Status Code Report | File Size Report | File Type Report | Directory Report | Failure Report | Request Report)
This report lists the total activity for each day of the week, summed over all the weeks in the report.
Each unit () represents 20 requests for pages or part thereof.
day | #reqs | #pages | |
---|---|---|---|
Sun | 0 | 0 | |
Mon | 0 | 0 | |
Tue | 0 | 0 | |
Wed | 0 | 0 | |
Thu | 2483 | 700 | |
Fri | 475 | 148 | |
Sat | 0 | 0 |
(Go To: Top | General Summary | Monthly Report | Weekly Report | Daily Report | Daily Summary | Hourly Summary | Domain Report | Organization Report | Host Report | Search Word Report | Operating System Report | Status Code Report | File Size Report | File Type Report | Directory Report | Failure Report | Request Report)
This report lists the total activity for each hour of the day, summed over all the days in the report.
Each unit () represents 2 requests for pages or part thereof.
hour | #reqs | #pages | |
---|---|---|---|
0 | 263 | 47 | |
1 | 106 | 36 | |
2 | 64 | 35 | |
3 | 40 | 28 | |
4 | 86 | 35 | |
5 | 264 | 64 | |
6 | 93 | 35 | |
7 | 282 | 45 | |
8 | 248 | 33 | |
9 | 165 | 34 | |
10 | 138 | 32 | |
11 | 90 | 33 | |
12 | 268 | 38 | |
13 | 161 | 63 | |
14 | 70 | 33 | |
15 | 46 | 31 | |
16 | 62 | 23 | |
17 | 146 | 37 | |
18 | 33 | 29 | |
19 | 33 | 27 | |
20 | 60 | 23 | |
21 | 166 | 30 | |
22 | 37 | 29 | |
23 | 37 | 28 |
(Go To: Top | General Summary | Monthly Report | Weekly Report | Daily Report | Daily Summary | Hourly Summary | Domain Report | Organization Report | Host Report | Search Word Report | Operating System Report | Status Code Report | File Size Report | File Type Report | Directory Report | Failure Report | Request Report)
This report lists the countries of the computers which requested files.
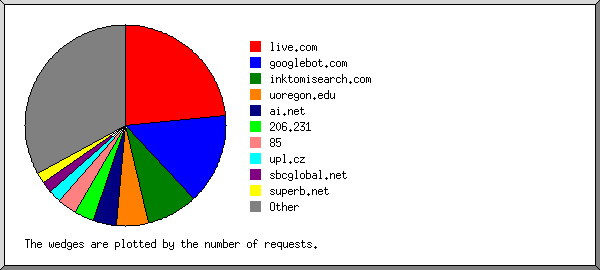
Listing domains, sorted by the amount of traffic.
#reqs | %bytes | domain |
---|---|---|
774 | 41.47% | [unresolved numerical addresses] |
517 | 28.73% | .com (Commercial) |
362 | 11.42% | .net (Networks) |
178 | 6.02% | .mx (Mexico) |
442 | 3.87% | .bt (Bhutan) |
68 | 2.21% | .ar (Argentina) |
14 | 1.37% | .ve (Venezuela) |
294 | 0.90% | .edu (US Higher Education) |
4 | 0.65% | .fr (France) |
10 | 0.48% | .co (Colombia) |
3 | 0.30% | .es (Spain) |
3 | 0.27% | .pe (Peru) |
33 | 0.26% | .br (Brazil) |
2 | 0.25% | .cl (Chile) |
4 | 0.23% | .de (Germany) |
1 | 0.19% | .arpa (Arpanet) |
71 | 0.16% | [unknown domain] |
1 | 0.15% | .uy (Uruguay) |
40 | 0.15% | .uk (United Kingdom) |
18 | 0.11% | .to (Tonga) |
1 | 0.10% | .ph (Philippines) |
61 | 0.09% | .pt (Portugal) |
4 | 0.09% | .my (Malaysia) |
1 | 0.08% | .us (United States) |
3 | 0.07% | .ma (Morocco) |
2 | 0.06% | .it (Italy) |
10 | 0.05% | .be (Belgium) |
2 | 0.04% | .se (Sweden) |
8 | 0.04% | .nl (Netherlands) |
6 | 0.03% | .org (Non Profit Making Organizations) |
2 | 0.03% | .mil (US Military) |
1 | 0.02% | .vn (Vietnam) |
1 | 0.02% | .gov (US Government) |
1 | 0.02% | .hk (Hong Kong) |
2 | 0.02% | .ca (Canada) |
1 | 0.01% | [domain not given] |
1 | 0.01% | .ch (Switzerland) |
6 | 0.01% | .sk (Slovakia) |
1 | 0.01% | .ru (Russia) |
1 | 0.01% | .il (Israel) |
1 | 0.01% | .cz (Czech Republic) |
1 | 0.01% | .jp (Japan) |
1 | .hu (Hungary) | |
1 | .au (Australia) |
(Go To: Top | General Summary | Monthly Report | Weekly Report | Daily Report | Daily Summary | Hourly Summary | Domain Report | Organization Report | Host Report | Search Word Report | Operating System Report | Status Code Report | File Size Report | File Type Report | Directory Report | Failure Report | Request Report)
This report lists the organizations of the computers which requested files.
Listing the top 20 organizations by the number of requests, sorted by the number of requests.
#reqs | %bytes | organization |
---|---|---|
442 | 3.87% | bt |
288 | uoregon.edu | |
272 | 20.47% | pemex.com |
193 | 15.25% | 200.5 |
140 | 6.64% | cantv.net |
126 | 6.31% | 202.141 |
86 | 1.23% | prod-infinitum.com.mx |
84 | 5.59% | msn.com |
77 | 1.90% | rima-tde.net |
71 | 0.16% | [unknown domain] |
66 | 2.10% | telecom.net.ar |
64 | 2.57% | 200.2 |
60 | 0.08% | telepac.pt |
52 | 0.10% | lankacom.net |
43 | 1.21% | caliente.com.mx |
39 | 0.11% | 200.164 |
38 | 0.67% | 193.159 |
35 | 0.16% | googlebot.com |
26 | 0.13% | pol.co.uk |
24 | 0.09% | looksmart.com |
732 | 31.36% | [not listed: 227 organizations] |
(Go To: Top | General Summary | Monthly Report | Weekly Report | Daily Report | Daily Summary | Hourly Summary | Domain Report | Organization Report | Host Report | Search Word Report | Operating System Report | Status Code Report | File Size Report | File Type Report | Directory Report | Failure Report | Request Report)
This report lists the computers which requested files.
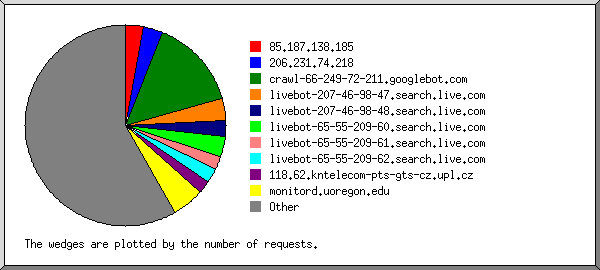
Listing the top 50 hosts by the number of requests, sorted alphabetically.
#reqs | %bytes | host |
---|---|---|
14 | 0.02% | 66.119.176.234 |
18 | 0.03% | 66.150.138.5 |
14 | 0.81% | 158.251.5.8 |
38 | 0.67% | 193.159.169.26 |
63 | 2.56% | 200.2.116.218 |
193 | 15.25% | 200.5.125.39 |
24 | 0.74% | 200.9.49.66 |
15 | 1.00% | 200.32.90.30 |
15 | 0.02% | 200.41.3.107 |
16 | 0.51% | 200.69.127.140 |
39 | 0.11% | 200.164.76.196 |
126 | 6.31% | 202.141.140.125 |
12 | 0.01% | 209.58.72.122 |
13 | 1.37% | 212.143.22.168 |
17 | 0.06% | 216.248.139.13 |
48 | 0.10% | host15.200-43-239.telecom.net.ar |
15 | 0.66% | host228.200-82-62.telecom.net.ar |
10 | 0.05% | 193-178-209-193.ing.be |
59 | 0.11% | host184.151.druknet.bt |
222 | 1.65% | host39.151.druknet.bt |
89 | 1.84% | host65.151.druknet.bt |
47 | 0.18% | host68.151.druknet.bt |
15 | 0.06% | dhcp3.mrrh.gov.bt |
22 | 0.08% | sv-crawlfw3.looksmart.com |
10 | 0.01% | user-119arsi.biz.mindspring.com |
84 | 5.59% | msnbot.msn.com |
272 | 20.47% | mandragora.pemex.com |
288 | monitord.uoregon.edu | |
69 | 0.15% | sasch1031302.phx.gbl |
14 | 1.38% | altair.cs.cinvestav.mx |
43 | 1.21% | host-193-194-in-prt.caliente.com.mx |
44 | 0.06% | dsl-201-129-55-38.prod-infinitum.com.mx |
12 | 0.02% | dsl-201-144-35-86.prod-infinitum.com.mx |
13 | 0.06% | dsl-201-153-196-135.prod-infinitum.com.mx |
17 | 0.65% | customer-148-223-143-193.uninet-ide.com.mx |
9 | 0.07% | office1.5ci.net |
48 | 0.13% | 200-84-10-37.genericrev.cantv.net |
48 | 0.12% | 200-84-47-60.genericrev.cantv.net |
28 | 5.36% | 201-249-41-248.genericrev.cantv.net |
10 | 0.08% | sfaras1-157.ras.sfa.cantv.net |
13 | 0.01% | 67-50-203-248.br1.clt.wi.frontiernet.net |
11 | 0.32% | 61-218-33-162.hinet-ip.hinet.net |
52 | 0.10% | cache2.lankacom.net |
16 | 1.37% | 80-58-32-42.proxycache.rima-tde.net |
48 | 0.06% | 80-58-9-234.proxycache.rima-tde.net |
59 | 0.08% | bl6-142-36.dsl.telepac.pt |
18 | 0.11% | fuakavenga.tcc.to |
11 | 0.01% | 80-193-189-16.cable.ubr01.wiga.blueyonder.co.uk |
26 | 0.13% | user-7922.l2.c4.dsl.pol.co.uk |
12 | 1.02% | tauro.rector.ula.ve |
539 | 27.23% | [not listed: 306 hosts] |
(Go To: Top | General Summary | Monthly Report | Weekly Report | Daily Report | Daily Summary | Hourly Summary | Domain Report | Organization Report | Host Report | Search Word Report | Operating System Report | Status Code Report | File Size Report | File Type Report | Directory Report | Failure Report | Request Report)
This report lists which words people used in search engines to find the site.
Listing the top 30 query words by the number of requests, sorted by the number of requests.
#reqs | search term |
---|---|
27 | de |
17 | cisco |
15 | freebsd |
13 | ppt |
12 | ip |
11 | router |
10 | exim |
9 | to |
8 | courier |
8 | bgp |
8 | |
7 | a |
7 | freaks |
7 | astral |
6 | in |
6 | defesa |
5 | como |
5 | imap |
5 | linux |
5 | pessoal |
4 | windows |
4 | apache |
4 | ejercicios |
4 | login |
4 | spanning |
4 | redes |
4 | how |
4 | authentication |
4 | comando |
4 | tree |
539 | [not listed: 394 search terms] |
(Go To: Top | General Summary | Monthly Report | Weekly Report | Daily Report | Daily Summary | Hourly Summary | Domain Report | Organization Report | Host Report | Search Word Report | Operating System Report | Status Code Report | File Size Report | File Type Report | Directory Report | Failure Report | Request Report)
This report lists the operating systems used by visitors.
Listing operating systems, sorted by the number of requests for pages.
# | #reqs | #pages | OS |
---|---|---|---|
1 | 1837 | 257 | Windows |
1392 | 167 | Windows XP | |
93 | 37 | Windows 98 | |
334 | 36 | Windows 2000 | |
9 | 9 | Windows ME | |
5 | 4 | Windows NT | |
2 | 2 | Windows 95 | |
2 | 2 | Windows Server 2003 | |
2 | 215 | 147 | Known robots |
3 | 409 | 74 | Unix |
367 | 51 | BSD | |
41 | 23 | Linux | |
1 | 0 | SunOS | |
4 | 78 | 52 | OS unknown |
5 | 131 | 30 | Macintosh |
(Go To: Top | General Summary | Monthly Report | Weekly Report | Daily Report | Daily Summary | Hourly Summary | Domain Report | Organization Report | Host Report | Search Word Report | Operating System Report | Status Code Report | File Size Report | File Type Report | Directory Report | Failure Report | Request Report)
This report lists the HTTP status codes of all requests.
Listing status codes, sorted numerically.
#reqs | status code |
---|---|
2176 | 200 OK |
584 | 206 Partial content |
12 | 301 Document moved permanently |
6 | 302 Document found elsewhere |
198 | 304 Not modified since last retrieval |
236 | 404 Document not found |
4 | 406 Document not acceptable to client |
(Go To: Top | General Summary | Monthly Report | Weekly Report | Daily Report | Daily Summary | Hourly Summary | Domain Report | Organization Report | Host Report | Search Word Report | Operating System Report | Status Code Report | File Size Report | File Type Report | Directory Report | Failure Report | Request Report)
This report lists the sizes of files.
size | #reqs | %bytes |
---|---|---|
0 | 509 | |
1B- 10B | 0 | |
11B- 100B | 24 | |
101B- 1kB | 211 | 0.05% |
1kB- 10kB | 1302 | 2.61% |
10kB-100kB | 567 | 10.28% |
100kB- 1MB | 305 | 46.77% |
1MB- 10MB | 40 | 40.29% |
(Go To: Top | General Summary | Monthly Report | Weekly Report | Daily Report | Daily Summary | Hourly Summary | Domain Report | Organization Report | Host Report | Search Word Report | Operating System Report | Status Code Report | File Size Report | File Type Report | Directory Report | Failure Report | Request Report)
This report lists the extensions of files.
Listing extensions with at least 0.1% of the traffic, sorted by the amount of traffic.
#reqs | %bytes | extension |
---|---|---|
792 | 76.89% | .pdf [Adobe Portable Document Format] |
358 | 9.65% | .jpeg [JPEG graphics] |
57 | 5.91% | .ppt |
349 | 1.40% | .jpg [JPEG graphics] |
4 | 1.19% | .zip [Zip archives] |
254 | 0.99% | .html [Hypertext Markup Language] |
552 | 0.94% | [directories] |
49 | 0.91% | .php [PHP] |
10 | 0.66% | .sxi |
4 | 0.55% | |
2 | 0.25% | .gz [Gzip compressed files] |
1 | 0.25% | .tar.gz [Compressed archives] |
42 | 0.23% | .htm [Hypertext Markup Language] |
287 | 0.19% | .gif [GIF graphics] |
198 | 0.22% | [not listed: 9 extensions] |
(Go To: Top | General Summary | Monthly Report | Weekly Report | Daily Report | Daily Summary | Hourly Summary | Domain Report | Organization Report | Host Report | Search Word Report | Operating System Report | Status Code Report | File Size Report | File Type Report | Directory Report | Failure Report | Request Report)
This report lists the directories from which files were requested. (The figures for each directory include all of its subdirectories.)
Listing directories with at least 0.01% of the traffic, sorted by the amount of traffic.
#reqs | %bytes | directory |
---|---|---|
2136 | 92.61% | /workshops/ |
55 | 5.27% | /data/ |
138 | 0.73% | /archive/ |
25 | 0.67% | /search/ |
21 | 0.27% | /materials/ |
326 | 0.16% | [root directory] |
26 | 0.13% | /planning/ |
141 | 0.05% | /images/ |
7 | 0.03% | /organizers/ |
7 | 0.02% | /cgi-bin/ |
4 | 0.02% | /instructors/ |
5 | 0.01% | /scripts/ |
67 | 0.04% | [not listed: 5 directories] |
(Go To: Top | General Summary | Monthly Report | Weekly Report | Daily Report | Daily Summary | Hourly Summary | Domain Report | Organization Report | Host Report | Search Word Report | Operating System Report | Status Code Report | File Size Report | File Type Report | Directory Report | Failure Report | Request Report)
This report lists the files that caused failures, for example files not found.
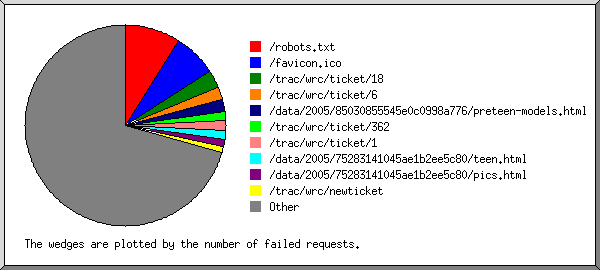
Listing files, sorted by the number of failed requests.
#reqs | file |
---|---|
130 | /favicon.ico |
41 | /robots.txt |
15 | /images/singlepix.gif |
11 | /planning/images/singlepix.gif |
5 | /search/images/singlepix.gif |
5 | /materials/images/singlepix.gif |
4 | /_vti_bin/shtml.exe/_vti_rpc |
4 | /_vti_inf.html |
3 | /workshops/2005/PACNOG-I/day1/crypto/outputtempfile0002e9330003.htm |
3 | /workshops/2005/PACNOG-I/day2/security/outputtempfile0002e8b70005.htm |
2 | /workshops/2005/PACNOG-I/day2/security/outputtempfile0002e8b70003.htm |
1 | /organizers/images/singlepix.gif |
1 | /workshops/2004/ccTLD-Amsterdam/dnssec... |
1 | /2001 |
1 | /2004 |
1 | /2005 |
1 | /workshops/2005/PACNOG-I/day1/freebsd/outputtempfile0002f0370004.htm |
1 | /workshops/2005/PACNOG-I/day3/ssh/'Reflection sshkeygen' |
1 | http://www.casino666.net/cgi-bin/ipboc2005.cgi |
1 | /data/2000/7965402764004e95ca159a/c |
1 | /workshops/2004/CEDIA/presentaciones/cv/intro/'Interconexion de FR e IP' |
1 | /workshops/2004/icann-kl/ |
1 | /workshops/2005/PACNOG-I/day1/freebsd/outputtempfile0002ee940006.htm |
1 | /scripts/images/singlepix.gif |
1 | /workshops/2005/PACNOG-I/day1/freebsd/outputtempfile0002f1040003.htm |
1 | /workshops/2004/cedia2 |
1 | /workshops/2004/cedia/isos/cedia1.iso |
1 | /workshops/2005/SANOG-VI/ip-services/routing/ |
(Go To: Top | General Summary | Monthly Report | Weekly Report | Daily Report | Daily Summary | Hourly Summary | Domain Report | Organization Report | Host Report | Search Word Report | Operating System Report | Status Code Report | File Size Report | File Type Report | Directory Report | Failure Report | Request Report)
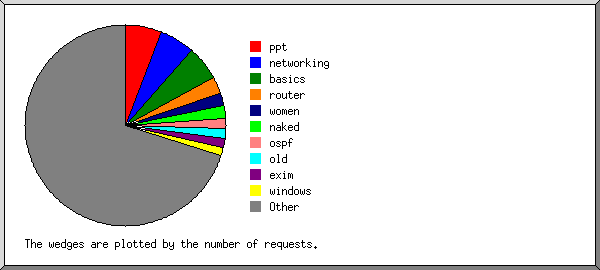
This report lists the files on the site.
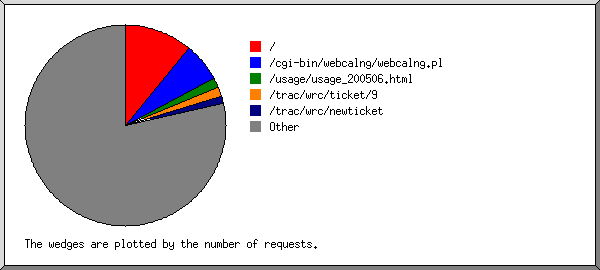
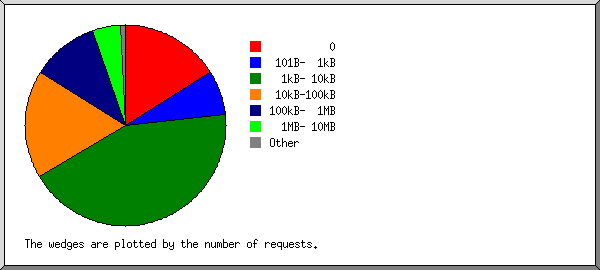
Listing files with at least 20 requests, sorted by the number of requests.
#reqs | %bytes | last time | file |
---|---|---|---|
324 | 0.15% | Jul/22/05 4:02 AM | / |
106 | 8.45% | Jul/21/05 5:48 PM | /workshops/2004/CEDIA2/material/IPv6.pdf |
70 | 3.18% | Jul/21/05 5:47 PM | /workshops/2004/CEDIA2/material/Introduccion_OSPF.pdf |
67 | 4.65% | Jul/21/05 9:12 PM | /workshops/2004/CEDIA/presentaciones/cv/intro/TCP-IP.pdf |
61 | 1.26% | Jul/21/05 12:10 PM | /workshops/2004/CEDIA2/material/Simulacion_Enrutamiento.pdf |
58 | 0.37% | Jul/22/05 12:48 AM | /archive/organizers/ |
47 | 3.91% | Jul/21/05 12:43 PM | /workshops/2004/CEDIA2/material/Arq_Resistente.pdf |
40 | 2.02% | Jul/21/05 12:56 PM | /workshops/2004/CEDIA2/material/ixp-sp.pdf |
39 | 6.11% | Jul/21/05 5:51 PM | /workshops/2004/CEDIA/presentaciones/cv/seguridad/Wireless-Security.pdf |
36 | 1.78% | Jul/21/05 12:05 PM | /workshops/2004/CEDIA2/material/Configuracion_Basica_Cisco.pdf |
31 | 3.06% | Jul/22/05 3:51 AM | /workshops/2004/CEDIA/presentaciones/cv/switching/Switching-Ethernet.pdf |
22 | 1.27% | Jul/21/05 1:45 PM | /workshops/2004/CEDIA2/material/Modulo_04-Estrategias_Multihoming_ipv6.pdf |
2057 | 63.79% | Jul/22/05 4:01 AM | [not listed: 626 files] |