Web Server Statistics for ISOC Workshop Resource Centre

Program started on Wed, Aug 17 2005 at 4:03 AM.
Analyzed requests from Tue, Aug 16 2005 at 4:04 AM to Wed, Aug 17 2005 at 4:03 AM (1.00 days).

General Summary

(Go To: Top | General Summary | Monthly Report | Weekly Report | Daily Report | Daily Summary | Hourly Summary | Domain Report | Organization Report | Host Report | Search Word Report | Operating System Report | Status Code Report | File Size Report | File Type Report | Directory Report | Failure Report | Request Report)

This report contains overall statistics.

Successful requests: 9,804
Average successful requests per day: 9,809
Successful requests for pages: 828
Average successful requests for pages per day: 827
Failed requests: 191
Redirected requests: 23
Distinct files requested: 7,982
Distinct hosts served: 472
Corrupt logfile lines: 229
Unwanted logfile entries: 12,281
Data transferred: 871.15 megabytes
Average data transferred per day: 871.76 megabytes

Monthly Report

(Go To: Top | General Summary | Monthly Report | Weekly Report | Daily Report | Daily Summary | Hourly Summary | Domain Report | Organization Report | Host Report | Search Word Report | Operating System Report | Status Code Report | File Size Report | File Type Report | Directory Report | Failure Report | Request Report)

This report lists the activity in each month.

Each unit (+) represents 25 requests for pages or part thereof.

month#reqs#pages 
Aug 20059804828++++++++++++++++++++++++++++++++++

Busiest month: Aug 2005 (828 requests for pages).

Weekly Report

(Go To: Top | General Summary | Monthly Report | Weekly Report | Daily Report | Daily Summary | Hourly Summary | Domain Report | Organization Report | Host Report | Search Word Report | Operating System Report | Status Code Report | File Size Report | File Type Report | Directory Report | Failure Report | Request Report)

This report lists the activity in each week.

Each unit (+) represents 25 requests for pages or part thereof.

week beg.#reqs#pages 
Aug/14/059804828++++++++++++++++++++++++++++++++++

Busiest week: week beginning Aug/14/05 (828 requests for pages).

Daily Report

(Go To: Top | General Summary | Monthly Report | Weekly Report | Daily Report | Daily Summary | Hourly Summary | Domain Report | Organization Report | Host Report | Search Word Report | Operating System Report | Status Code Report | File Size Report | File Type Report | Directory Report | Failure Report | Request Report)

This report lists the activity in each day.

Each unit (+) represents 20 requests for pages or part thereof.

date#reqs#pages 
Aug/16/058516678++++++++++++++++++++++++++++++++++
Aug/17/051288150++++++++

Busiest day: Aug/16/05 (678 requests for pages).

Daily Summary

(Go To: Top | General Summary | Monthly Report | Weekly Report | Daily Report | Daily Summary | Hourly Summary | Domain Report | Organization Report | Host Report | Search Word Report | Operating System Report | Status Code Report | File Size Report | File Type Report | Directory Report | Failure Report | Request Report)

This report lists the total activity for each day of the week, summed over all the weeks in the report.

Each unit (+) represents 20 requests for pages or part thereof.

day#reqs#pages 
Sun00
Mon00
Tue8516678++++++++++++++++++++++++++++++++++
Wed1288150++++++++
Thu00
Fri00
Sat00

Hourly Summary

(Go To: Top | General Summary | Monthly Report | Weekly Report | Daily Report | Daily Summary | Hourly Summary | Domain Report | Organization Report | Host Report | Search Word Report | Operating System Report | Status Code Report | File Size Report | File Type Report | Directory Report | Failure Report | Request Report)

This report lists the total activity for each hour of the day, summed over all the days in the report.

Each unit (+) represents 3 requests for pages or part thereof.

hour#reqs#pages 
096550+++++++++++++++++
19228++++++++++
215236++++++++++++
37534++++++++++++
44724++++++++
56326+++++++++
614328++++++++++
723246++++++++++++++++
85030++++++++++
924843+++++++++++++++
1086534++++++++++++
1179026+++++++++
1281032+++++++++++
1381131+++++++++++
1492936++++++++++++
155733+++++++++++
164226+++++++++
1720193+++++++++++++++++++++++++++++++
186344+++++++++++++++
194020+++++++
2089129++++++++++
2157324++++++++
2290323++++++++
2376232+++++++++++

Domain Report

(Go To: Top | General Summary | Monthly Report | Weekly Report | Daily Report | Daily Summary | Hourly Summary | Domain Report | Organization Report | Host Report | Search Word Report | Operating System Report | Status Code Report | File Size Report | File Type Report | Directory Report | Failure Report | Request Report)

This report lists the countries of the computers which requested files.

Listing domains, sorted by the amount of traffic.

#reqs%bytesdomain
787370.66%.com (Commercial)
59121.39%[unresolved numerical addresses]
234 1.28%.net (Networks)
115 1.27%.br (Brazil)
164 1.08%.mx (Mexico)
20 0.59%.co (Colombia)
10 0.57%.de (Germany)
54 0.41%.bt (Bhutan)
35 0.38%.es (Spain)
87 0.34%.pe (Peru)
77 0.22%.cl (Chile)
14 0.21%.in (India)
5 0.21%.ar (Argentina)
4 0.15%.it (Italy)
30 0.14%.mil (US Military)
10 0.13%.do (Dominican Republic)
2 0.09%.arpa (Arpanet)
9 0.08%.fr (France)
1 0.07%.sa (Saudi Arabia)
3 0.07%.ch (Switzerland)
2 0.07%.id (Indonesia)
2 0.05%.tw (Taiwan)
3 0.05%.ru (Russia)
2 0.05%[domain not given]
12 0.04%.uk (United Kingdom)
1 0.04%.hu (Hungary)
27 0.04%.jp (Japan)
5 0.03%.et (Ethiopia)
3 0.03%.au (Australia)
1 0.03%.ro (Romania)
2 0.03%.pl (Poland)
4 0.03%.nl (Netherlands)
1 0.02%.gt (Guatemala)
1 0.02%.ve (Venezuela)
37 0.02%.ug (Uganda)
3 0.01%.cz (Czech Republic)
320 0.01%.edu (US Higher Education)
1 0.01%.sg (Singapore)
8 0.01%.pt (Portugal)
1 0.01%.gov (US Government)
9 0.01%[unknown domain]
3 0.01%.be (Belgium)
4 0.01%.ca (Canada)
1 .ee (Estonia)
6 .at (Austria)
3 .my (Malaysia)
1 .org (Non Profit Making Organizations)
1 .om (Oman)
1 .py (Paraguay)
1 .dk (Denmark)

Organization Report

(Go To: Top | General Summary | Monthly Report | Weekly Report | Daily Report | Daily Summary | Hourly Summary | Domain Report | Organization Report | Host Report | Search Word Report | Operating System Report | Status Code Report | File Size Report | File Type Report | Directory Report | Failure Report | Request Report)

This report lists the organizations of the computers which requested files.

Listing the top 20 organizations by the number of requests, sorted by the number of requests.

#reqs%bytesorganization
754269.40%googlebot.com
300 uoregon.edu
83 0.02%mindspring.com
71 0.33%speedy.net.pe
7011.86%211.55
58 0.60%148.216
54 0.41%bt
53 0.06%cantv.net
48 0.01%megared.net.mx
47 0.01%200.32
47 0.01%ctrmax.cl
47 0.01%redaccionline.com
47 0.01%famerp.br
44 0.03%hinet.net
43 0.03%200.72
38 0.47%prod-infinitum.com.mx
38 0.03%avantel.net.mx
37 0.02%mtn.co.ug
34 0.58%rima-tde.net
30 0.08%inktomisearch.com
107316.03%[not listed: 294 organizations]

Host Report

(Go To: Top | General Summary | Monthly Report | Weekly Report | Daily Report | Daily Summary | Hourly Summary | Domain Report | Organization Report | Host Report | Search Word Report | Operating System Report | Status Code Report | File Size Report | File Type Report | Directory Report | Failure Report | Request Report)

This report lists the computers which requested files.

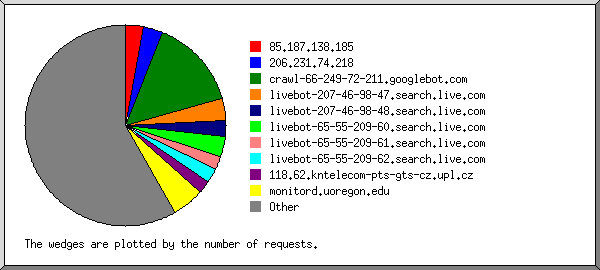
Listing the top 50 hosts by the number of requests, sorted alphabetically.

#reqs%byteshost
58 0.60%148.216.5.239
11 165.127.196.226
47 0.01%200.32.73.57
22 0.11%200.61.224.2
43 0.03%200.72.26.158
15 0.08%200.89.16.66
13 0.45%200.106.35.220
16 0.13%200.121.102.42
20 0.55%200.122.207.30
14 202.131.225.83
18 0.14%203.145.155.10
7011.86%211.55.20.81
20 2.32%212.143.22.168
47 0.01%morpheus.famerp.br
12 0.01%201.22.234.146.adsl.gvt.net.br
54 0.41%dhcp13.mof.gov.bt
47 0.01%pc-12.ctrmax.cl
28 0.02%90-206-78.adsl.cust.tie.cl
366 1.97%crawl-66-249-65-165.googlebot.com
231 1.32%crawl-66-249-66-116.googlebot.com
539524.37%crawl-66-249-66-39.googlebot.com
1440 7.75%crawl-66-249-66-6.googlebot.com
12 0.01%sv-crawl.looksmart.com
13 0.19%host-216-23-196-235.meriplex.com
67 0.02%user-v8ldv12.dsl.mindspring.com
16 user-v8ldv1p.dsl.mindspring.com
21 0.03%msnbot.msn.com
12 0.03%n219078191028.netvigator.com
25 0.09%81-203-245-184.user.ono.com
47 0.01%redaccionline.com
13 dhcp-168-40.eecs.berkeley.edu
300 monitord.uoregon.edu
18 0.29%intra-bt.bt.es
17 0.09%fw-65-238.go.retevision.es
20 0.01%mwo.microtek.co.jp
11 0.21%dsl-201-153-204-198.prod-infinitum.com.mx
14 0.18%red77-073.cem.itesm.mx
38 0.03%na-200-78-143-101.na.avantel.net.mx
23 0.01%customer-gdl-static-193-231.megared.net.mx
23 0.01%customer-gdl-static-193-234.megared.net.mx
12 0.01%69-170-44-183.chvlva.adelphia.net
50 0.03%201-249-31-135.genericrev.cantv.net
43 0.03%61-229-178-212.dynamic.hinet.net
14 0.03%webcache-10.th.ifl.net
12 0.18%120.red-81-35-162.pooles.rima-tde.net
18 0.38%147.red-83-37-27.pooles.rima-tde.net
15 0.01%host-216-244-144-68.telmex.com.pe
14 0.22%client-200.107.153.210.speedy.net.pe
48 0.03%client-200.121.178.90.speedy.net.pe
37 0.02%ping.mtn.co.ug
86445.70%[not listed: 422 hosts]

Search Word Report

(Go To: Top | General Summary | Monthly Report | Weekly Report | Daily Report | Daily Summary | Hourly Summary | Domain Report | Organization Report | Host Report | Search Word Report | Operating System Report | Status Code Report | File Size Report | File Type Report | Directory Report | Failure Report | Request Report)

This report lists which words people used in search engines to find the site.

Listing the top 30 query words by the number of requests, sorted by the number of requests.

#reqssearch term
26cisco
22ppt
18router
18de
16freebsd
13ospf
12to
11network
10windows
10bgp
9bind
9exim
9configuration
8defesa
8freaks
8astral
8pessoal
7apache
7vs
7how
7security
7pdf
6address
6config
6certificate
6vlan
6dns
5ip
5command
5start
762[not listed: 543 search terms]

Operating System Report

(Go To: Top | General Summary | Monthly Report | Weekly Report | Daily Report | Daily Summary | Hourly Summary | Domain Report | Organization Report | Host Report | Search Word Report | Operating System Report | Status Code Report | File Size Report | File Type Report | Directory Report | Failure Report | Request Report)

This report lists the operating systems used by visitors.

Listing operating systems, sorted by the number of requests for pages.

##reqs#pagesOS
11563274Windows
 1199209  Windows XP
 14927  Windows 98
 13527  Windows 2000
 256  Windows Server 2003
 22  Windows 95
 522  Windows ME
 11  Windows NT
2202106Known robots
3750488OS unknown
415138Unix
 14532  Linux
 66  BSD
5688Macintosh

Status Code Report

(Go To: Top | General Summary | Monthly Report | Weekly Report | Daily Report | Daily Summary | Hourly Summary | Domain Report | Organization Report | Host Report | Search Word Report | Operating System Report | Status Code Report | File Size Report | File Type Report | Directory Report | Failure Report | Request Report)

This report lists the HTTP status codes of all requests.

Listing status codes, sorted numerically.

#reqsstatus code
9253200 OK
425206 Partial content
13301 Document moved permanently
10302 Document found elsewhere
126304 Not modified since last retrieval
186404 Document not found
3405 Method not allowed
2406 Document not acceptable to client

File Size Report

(Go To: Top | General Summary | Monthly Report | Weekly Report | Daily Report | Daily Summary | Hourly Summary | Domain Report | Organization Report | Host Report | Search Word Report | Operating System Report | Status Code Report | File Size Report | File Type Report | Directory Report | Failure Report | Request Report)

This report lists the sizes of files.

size#reqs%bytes
0463 
1B- 10B0 
11B- 100B12 
101B- 1kB174 0.01%
1kB- 10kB914 0.37%
10kB-100kB637414.29%
100kB- 1MB179734.46%
1MB- 10MB6614.85%
10MB-100MB314.89%
100MB- 1GB121.13%

File Type Report

(Go To: Top | General Summary | Monthly Report | Weekly Report | Daily Report | Daily Summary | Hourly Summary | Domain Report | Organization Report | Host Report | Search Word Report | Operating System Report | Status Code Report | File Size Report | File Type Report | Directory Report | Failure Report | Request Report)

This report lists the extensions of files.

Listing extensions with at least 0.1% of the traffic, sorted by the amount of traffic.

#reqs%bytesextension
735735.03%.pl [Perl scripts]
531.81%.iso
59726.62%.pdf [Adobe Portable Document Format]
7 2.38%.gz [Gzip compressed files]
7 2.38%  .ps.gz [Gzipped PostScript]
104 2.36%.ppt
396 0.55%.jpg [JPEG graphics]
247 0.29%.html [Hypertext Markup Language]
549 0.21%[directories]
21 0.20%.txt [Plain text]
16 0.19%.jpeg [JPEG graphics]
47 0.11%.php [PHP]
458 0.25%[not listed: 11 extensions]

Directory Report

(Go To: Top | General Summary | Monthly Report | Weekly Report | Daily Report | Daily Summary | Hourly Summary | Domain Report | Organization Report | Host Report | Search Word Report | Operating System Report | Status Code Report | File Size Report | File Type Report | Directory Report | Failure Report | Request Report)

This report lists the directories from which files were requested. (The figures for each directory include all of its subdirectories.)

Listing directories with at least 0.01% of the traffic, sorted by the amount of traffic.

#reqs%bytesdirectory
145150.82%/workshops/
735735.03%/cgi-bin/
18113.70%/data/
184 0.22%/archive/
345 0.08%[root directory]
16 0.08%/materials/
10 0.02%/peer-review/
170 0.01%/images/
11 0.01%/search/
79 0.03%[not listed: 8 directories]

Failure Report

(Go To: Top | General Summary | Monthly Report | Weekly Report | Daily Report | Daily Summary | Hourly Summary | Domain Report | Organization Report | Host Report | Search Word Report | Operating System Report | Status Code Report | File Size Report | File Type Report | Directory Report | Failure Report | Request Report)

This report lists the files that caused failures, for example files not found.

Listing files, sorted by the number of failed requests.

#reqsfile
101/favicon.ico
49/robots.txt
13/images/singlepix.gif
5/materials/images/singlepix.gif
4/_vti_inf.html
3/organizers/images/singlepix.gif
3/hbr.htm
2/_vti_bin/shtml.exe/_vti_rpc
1/workshops/2004/CEDIA/presentaciones/bc/correo/courier
1/planning/images/singlepix.gif
1/archive/ke-cctld/
1/MSOffice/cltreq.asp
1/archive/organizers/xalets.htm
1/archive/organizers/precios.htm
1/_vti_bin/owssvr.dll
1/scripts/images/singlepix.gif
1/workshop.html
1/workshops/2004/cedia/isos/cedia1.iso
1/archive/organizers/ACABADOS-2.htm

Request Report

(Go To: Top | General Summary | Monthly Report | Weekly Report | Daily Report | Daily Summary | Hourly Summary | Domain Report | Organization Report | Host Report | Search Word Report | Operating System Report | Status Code Report | File Size Report | File Type Report | Directory Report | Failure Report | Request Report)

This report lists the files on the site.

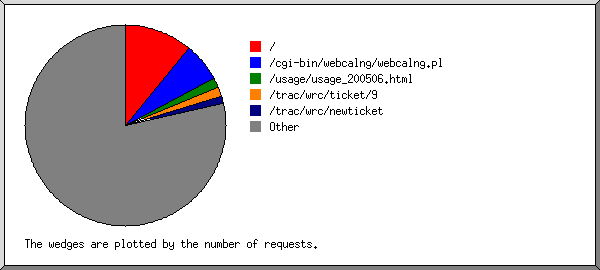
Listing files with at least 20 requests, sorted by the number of requests.

#reqs%byteslast timefile
735735.03%Aug/17/05 3:50 AM/cgi-bin/webcalng/webcalng.pl
334 0.06%Aug/17/05 4:00 AM/
69 4.22%Aug/17/05 3:09 AM/workshops/2004/CEDIA/presentaciones/cv/seguridad/Wireless-Security.pdf
55 0.92%Aug/16/05 10:09 PM/workshops/2004/CEDIA/presentaciones/cv/intro/TCP-IP.pdf
50 0.09%Aug/16/05 11:23 PM/archive/organizers/
48 0.94%Aug/17/05 1:43 AM/workshops/2004/CEDIA2/material/Arq_Resistente.pdf
44 0.33%Aug/16/05 9:47 PM/workshops/2004/CEDIA2/material/Configuracion_Basica_Cisco.pdf
30 0.36%Aug/16/05 10:13 PM/workshops/2004/CEDIA/presentaciones/cv/nat/Conceptos-NAT.pdf
28 0.54%Aug/17/05 12:29 AM/workshops/2004/CEDIA/presentaciones/cv/switching/Switching-Ethernet.pdf
24 0.45%Aug/17/05 2:41 AM/workshops/2005/SANOG-VI/ip-services/day3/squid/Running_SQUID_in_FreeBSD.pdf
21 0.74%Aug/16/05 5:21 PM/workshops/2004/CEDIA2/material/IPv6.pdf
21 1.41%Aug/17/05 12:26 AM/data/2004/629197984427ef56fc2cd1/sanog4-aarati-voiptut.pdf
172354.91%Aug/17/05 4:03 AM[not listed: 582 files]