(Go To: Top | General Summary | Monthly Report | Weekly Report | Daily Report | Daily Summary | Hourly Summary | Domain Report | Organization Report | Host Report | Search Word Report | Operating System Report | Status Code Report | File Size Report | File Type Report | Directory Report | Failure Report | Request Report)
This report lists the countries of the computers which requested files.

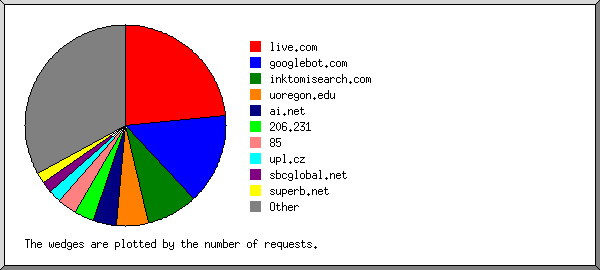
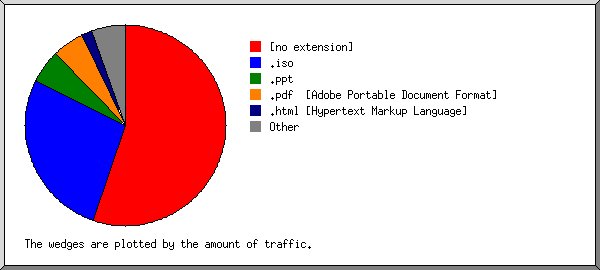
Listing domains, sorted by the amount of traffic.
| #reqs | %bytes | domain |
|---|
| 4229 | 39.30% | .com (Commercial) |
| 764 | 27.47% | [unresolved numerical addresses] |
| 373 | 16.83% | .net (Networks) |
| 116 | 2.47% | .mx (Mexico) |
| 127 | 2.39% | .ar (Argentina) |
| 79 | 1.96% | .br (Brazil) |
| 98 | 1.87% | .es (Spain) |
| 14 | 0.86% | .fr (France) |
| 32 | 0.75% | .co (Colombia) |
| 58 | 0.63% | .ec (Ecuador) |
| 7 | 0.55% | .cr (Costa Rica) |
| 45 | 0.54% | .arpa (Arpanet) |
| 13 | 0.38% | .ve (Venezuela) |
| 33 | 0.35% | .uk (United Kingdom) |
| 18 | 0.34% | .py (Paraguay) |
| 1 | 0.28% | .ph (Philippines) |
| 17 | 0.27% | .gt (Guatemala) |
| 345 | 0.26% | .edu (US Higher Education) |
| 59 | 0.25% | .pe (Peru) |
| 20 | 0.23% | .de (Germany) |
| 12 | 0.21% | .gr (Greece) |
| 7 | 0.21% | .pk (Pakistan) |
| 6 | 0.20% | .uy (Uruguay) |
| 15 | 0.19% | .in (India) |
| 5 | 0.18% | .ca (Canada) |
| 4 | 0.16% | .be (Belgium) |
| 4 | 0.09% | .au (Australia) |
| 2 | 0.08% | .th (Thailand) |
| 36 | 0.07% | [unknown domain] |
| 4 | 0.06% | .id (Indonesia) |
| 17 | 0.06% | .dk (Denmark) |
| 16 | 0.05% | .nl (Netherlands) |
| 1 | 0.05% | .bw (Botswana) |
| 6 | 0.04% | .nz (New Zealand) |
| 1 | 0.04% | .nc (New Caledonia) |
| 1 | 0.03% | .cl (Chile) |
| 1 | 0.03% | .us (United States) |
| 2 | 0.03% | .fi (Finland) |
| 1 | 0.03% | .aw (Aruba) |
| 5 | 0.03% | .pl (Poland) |
| 3 | 0.02% | .sg (Singapore) |
| 9 | 0.02% | .se (Sweden) |
| 2 | 0.02% | .lt (Lithuania) |
| 1 | 0.02% | .no (Norway) |
| 1 | 0.02% | .ky (Cayman Islands) |
| 6 | 0.01% | .pt (Portugal) |
| 1 | 0.01% | .my (Malaysia) |
| 6 | 0.01% | .cz (Czech Republic) |
| 1 | 0.01% | .zw (Zimbabwe) |
| 2 | 0.01% | .jp (Japan) |
| 2 | | .at (Austria) |
| 2 | | .it (Italy) |
| 2 | | .np (Nepal) |
| 1 | | .bg (Bulgaria) |
| 1 | | .ee (Estonia) |
| 1 | | .ua (Ukraine) |
| 1 | | .ru (Russia) |
(Go To: Top | General Summary | Monthly Report | Weekly Report | Daily Report | Daily Summary | Hourly Summary | Domain Report | Organization Report | Host Report | Search Word Report | Operating System Report | Status Code Report | File Size Report | File Type Report | Directory Report | Failure Report | Request Report)
This report lists the computers which requested files.
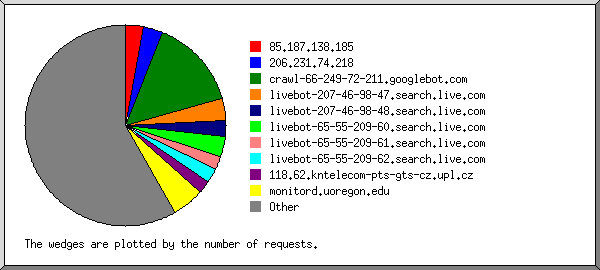
Listing the top 50 hosts by the number of requests, sorted alphabetically.
| #reqs | %bytes | host |
|---|
| 13 | 0.27% | 65.164.150.42 |
| 80 | 0.08% | 69.41.60.25 |
| 88 | 0.19% | 167.196.240.215 |
| 75 | 0.06% | 193.220.22.1 |
| 20 | 0.04% | 195.47.241.144 |
| 16 | 0.38% | 200.2.64.3 |
| 14 | 0.01% | 200.41.3.107 |
| 42 | 0.02% | 201.19.52.46 |
| 25 | 0.09% | 203.91.139.238 |
| 15 | 0.07% | 203.145.155.10 |
| 17 | 0.39% | 208.165.63.35 |
| 20 | 3.20% | 212.143.22.168 |
| 11 | 0.44% | 39-201-126-200.fibertel.com.ar |
| 96 | 1.20% | 201-255-196-65.mrse.com.ar |
| 33 | 0.04% | cm-200.124.23.60.cableonda.net.23.124.200.in-addr.arpa |
| 12 | 0.51% | srv13.iempt.net.124.18.209.in-addr.arpa |
| 25 | 0.12% | 200165022038.user.veloxzone.com.br |
| 21 | 0.14% | cable200-116-138-38.epm.net.co |
| 105 | 0.08% | egspd42469.ask.com |
| 13 | | cvgsinet1.convergys.com |
| 12 | 0.01% | nii.gh.com |
| 3699 | 29.28% | crawl-66-249-65-242.googlebot.com |
| 60 | 2.54% | msnbot.msn.com |
| 40 | 0.49% | mkedef1.rockwellautomation.com |
| 12 | 0.02% | return.netnord.dk |
| 58 | 0.63% | corp-200-105-254-192-uio.punto.net.ec |
| 40 | 0.03% | d215-61.uoregon.edu |
| 288 | | monitord.uoregon.edu |
| 58 | 0.96% | relaysmtp.bolsasymercados.es |
| 19 | 0.42% | eu99-83-145.clientes.euskaltel.es |
| 18 | 0.40% | bcnfwl02.retevision.es |
| 12 | | sasch1031302.phx.gbl |
| 24 | 0.06% | sasch1031308.phx.gbl |
| 11 | 0.10% | leda.ccf.auth.gr |
| 17 | 0.27% | 188.147.intelnet.net.gt |
| 16 | 0.66% | dsl-201-144-187-40.prod-infinitum.com.mx |
| 12 | 0.18% | 104-20.reduno.com.mx |
| 14 | 0.34% | 201-243-72-24.genericrev.cantv.net |
| 12 | 0.03% | 201-248-246-107.genericrev.cantv.net |
| 14 | 0.01% | d32-169.rt-bras.wnvl.centurytel.net |
| 91 | 0.79% | wsip-24-234-95-100.lv.lv.cox.net |
| 18 | 0.01% | onatel.its-dc.globalconnex.net |
| 12 | | adsl-69-227-249-164.dsl.pltn13.pacbell.net |
| 12 | 0.01% | dsl-64-5-15-89.eugene.pciwest.net |
| 18 | 0.42% | 80-58-1-172.proxycache.rima-tde.net |
| 15 | 11.64% | 80-58-41-42.proxycache.rima-tde.net |
| 48 | 0.04% | client-200.106.102.124.speedy.net.pe |
| 18 | 0.34% | server.conexion.com.py |
| 12 | | 82-68-206-22.dsl.in-addr.zen.co.uk |
| 13 | 0.38% | red_200.41.117_cust_13.static.impsat.net.ve |
| 1202 | 42.65% | [not listed: 638 hosts] |
(Go To: Top | General Summary | Monthly Report | Weekly Report | Daily Report | Daily Summary | Hourly Summary | Domain Report | Organization Report | Host Report | Search Word Report | Operating System Report | Status Code Report | File Size Report | File Type Report | Directory Report | Failure Report | Request Report)
This report lists the files that caused failures, for example files not found.
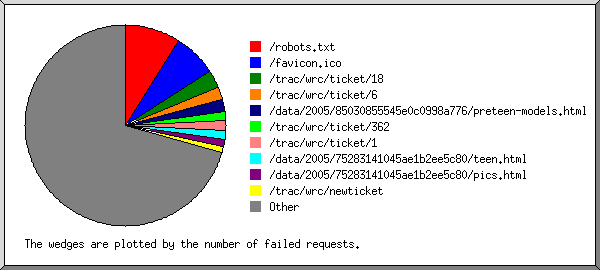
Listing the top 30 files by the number of failed requests, sorted by the number of failed requests.
| #reqs | file |
|---|
| 323 | /favicon.ico |
| 50 | /robots.txt |
| 10 | /images/singlepix.gif |
| 5 | /planning/images/singlepix.gif |
| 5 | /search/images/singlepix.gif |
| 4 | /gifs/rightguy.gif |
| 4 | /materials/images/singlepix.gif |
| 4 | /gifs/leftguy.gif |
| 3 | /calendar/images/singlepix.gif |
| 3 | /workshops/2005/pre-SANOG-VI/ha/intro-freebsd/mount-unmount.html |
| 3 | /_vti_bin/shtml.exe/_vti_rpc |
| 3 | /workshops/2005/pre-SANOG-VI/ha/intro-freebsd/docbook.css |
| 3 | /_vti_inf.html |
| 2 | /workshops/2005/PACNOG-I/day1/mail/outputtempfile0005267e0001.htm |
| 2 | /workshops/2005/PACNOG-I/day1/mail/outputtempfile000525b20001.htm |
| 2 | /workshops/2005/CEDIA |
| 2 | /workshops/2005/PACNOG-I/day1/mail/outputtempfile0005255e0001.htm |
| 2 | /workshops/2005/PACNOG-I/day1/mail/outputtempfile0005267e0002.htm |
| 2 | /archive/Ej-1.htm |
| 2 | /workshops/2005/PACNOG-I/day1/mail/outputtempfile000525b20002.htm |
| 2 | /workshops/ 2004/ |
| 2 | /workshops/2005/PACNOG-I/day1/mail/outputtempfile0005255e0002.htm |
| 2 | /utils/ |
| 2 | /workshops/2005/PACNOG-I/day1/mail/outputtempfile000523d50001.htm |
| 1 | /organizers/images/singlepix.gif |
| 1 | /SlurpConfirm404/alluring.htm |
| 1 | /workshops/2005/pre-SANOG-VI/ha/intro-freebsd/ |
| 1 | /data/2000/7965402764004e95ca159a/ciscocnf.ppt |
| 1 | /workshops/2005/pre-SANOG-VI/ha/intro-freebsd/permissions.html |
| 1 | /SlurpConfirm404/equipa.htm |
| 7 | [not listed: 7 files] |
(Go To: Top | General Summary | Monthly Report | Weekly Report | Daily Report | Daily Summary | Hourly Summary | Domain Report | Organization Report | Host Report | Search Word Report | Operating System Report | Status Code Report | File Size Report | File Type Report | Directory Report | Failure Report | Request Report)
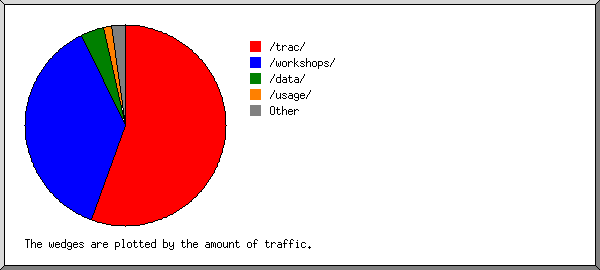
This report lists the files on the site.
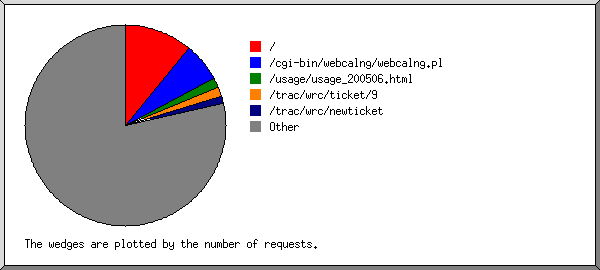
Listing files with at least 20 requests, sorted by the number of requests.
| #reqs | %bytes | last time | file |
|---|
| 3693 | 25.84% | Aug/25/05 3:52 AM | /cgi-bin/webcalng/webcalng.pl |
| 316 | 0.07% | Aug/25/05 4:00 AM | / |
| 141 | 4.41% | Aug/25/05 3:29 AM | /workshops/2004/CEDIA2/material/Arq_Resistente.pdf |
| 77 | 2.02% | Aug/24/05 8:14 PM | /workshops/2004/CEDIA/presentaciones/cv/intro/TCP-IP.pdf |
| 67 | 0.18% | Aug/25/05 3:34 AM | /archive/organizers/ |
| 59 | 6.47% | Aug/25/05 3:01 AM | /workshops/2004/CEDIA/presentaciones/cv/seguridad/Wireless-Security.pdf |
| 39 | 0.41% | Aug/24/05 1:06 PM | /workshops/2004/CEDIA2/material/Enrutamiento_Estatico.pdf |
| 33 | 0.40% | Aug/25/05 3:24 AM | /workshops/2004/CEDIA2/material/Introduccion_OSPF.pdf |
| 30 | | Aug/25/05 2:41 AM | /icons/blank.gif |
| 30 | | Aug/25/05 2:41 AM | /icons/back.gif |
| 29 | 0.21% | Aug/25/05 3:43 AM | /data/2000/7965402764004e95ca159a/ciscocnf.ppt |
| 28 | 0.86% | Aug/25/05 1:59 AM | /data/2003/145088522400b83f9b7630/ciscointro.ppt |
| 24 | 0.40% | Aug/25/05 3:28 AM | /workshops/2004/CEDIA2/material/Modulo_01a-OSPF_iBGP_Basico_ipv6.pdf |
| 21 | 0.67% | Aug/24/05 6:12 PM | /workshops/2004/CEDIA/presentaciones/cv/switching/Switching-Ethernet.pdf |
| 20 | 0.38% | Aug/25/05 1:35 AM | /workshops/2005/SANOG-VI/routing/materials/a2-6up.pdf |
| 2029 | 57.68% | Aug/25/05 4:04 AM | [not listed: 832 files] |
 Web Server Statistics for ISOC Workshop Resource Centre
 ) represents 30 requests for pages or part thereof.