(Go To: Top | General Summary | Monthly Report | Weekly Report | Daily Report | Daily Summary | Hourly Summary | Domain Report | Organization Report | Host Report | Search Word Report | Operating System Report | Status Code Report | File Size Report | File Type Report | Directory Report | Failure Report | Request Report)
This report lists the countries of the computers which requested files.

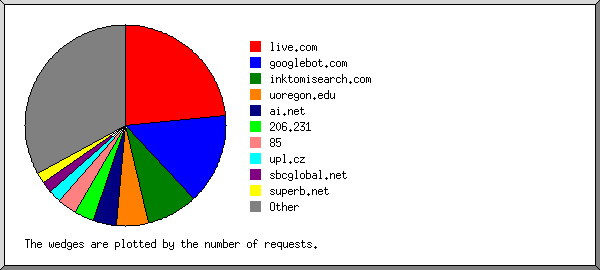
Listing domains, sorted by the amount of traffic.
| #reqs | %bytes | domain |
|---|
| 755 | 83.49% | .com (Commercial) |
| 403 | 10.42% | .net (Networks) |
| 699 | 2.89% | [unresolved numerical addresses] |
| 52 | 0.52% | .pe (Peru) |
| 112 | 0.39% | .br (Brazil) |
| 125 | 0.39% | .co (Colombia) |
| 79 | 0.36% | .ar (Argentina) |
| 7 | 0.23% | .au (Australia) |
| 76 | 0.20% | .mx (Mexico) |
| 18 | 0.18% | .mil (US Military) |
| 14 | 0.17% | .fr (France) |
| 8 | 0.16% | .org (Non Profit Making Organizations) |
| 5 | 0.08% | .yu (Former Yugoslavia) |
| 2 | 0.06% | .lu (Luxembourg) |
| 5 | 0.06% | .gov (US Government) |
| 6 | 0.05% | .fi (Finland) |
| 14 | 0.04% | .gl (Greenland) |
| 6 | 0.04% | .es (Spain) |
| 16 | 0.04% | .in (India) |
| 9 | 0.03% | .pt (Portugal) |
| 4 | 0.03% | .lk (Sri Lanka) |
| 6 | 0.03% | .de (Germany) |
| 25 | 0.02% | .nl (Netherlands) |
| 43 | 0.02% | .ca (Canada) |
| 2 | 0.02% | .do (Dominican Republic) |
| 299 | 0.02% | .edu (US Higher Education) |
| 2 | 0.01% | .sm (San Marino) |
| 3 | 0.01% | .it (Italy) |
| 2 | 0.01% | .cl (Chile) |
| 1 | 0.01% | .ve (Venezuela) |
| 1 | 0.01% | .pl (Poland) |
| 15 | 0.01% | .us (United States) |
| 26 | 0.01% | .nz (New Zealand) |
| 3 | 0.01% | .jp (Japan) |
| 9 | | .uy (Uruguay) |
| 12 | | .bg (Bulgaria) |
| 1 | | .by (Belarus) |
| 2 | | .ch (Switzerland) |
| 4 | | .ru (Russia) |
| 2 | | .dk (Denmark) |
| 3 | | .at (Austria) |
| 1 | | .se (Sweden) |
| 1 | | .sg (Singapore) |
| 1 | | .uk (United Kingdom) |
| 1 | | .be (Belgium) |
| 1 | | .ma (Morocco) |
| 2 | | .ec (Ecuador) |
(Go To: Top | General Summary | Monthly Report | Weekly Report | Daily Report | Daily Summary | Hourly Summary | Domain Report | Organization Report | Host Report | Search Word Report | Operating System Report | Status Code Report | File Size Report | File Type Report | Directory Report | Failure Report | Request Report)
This report lists the computers which requested files.
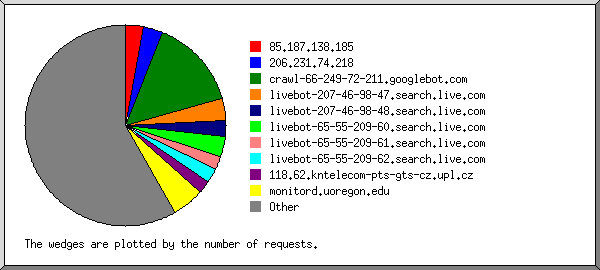
Listing the top 50 hosts by the number of requests, sorted alphabetically.
| #reqs | %bytes | host |
|---|
| 19 | 0.04% | 64.4.8.93 |
| 13 | | 64.210.196.197 |
| 51 | 0.01% | 85.102.218.11 |
| 12 | 0.10% | 166.114.106.8 |
| 53 | 0.22% | 192.188.58.33 |
| 18 | 0.09% | 193.146.93.1 |
| 154 | 0.21% | 200.21.84.254 |
| 20 | 0.01% | 200.106.9.78 |
| 55 | 0.11% | 201.240.190.78 |
| 13 | | 213.145.38.15 |
| 13 | 0.15% | pc60.telecentro.com.ar |
| 16 | 0.07% | host130.200-45-21.telecom.net.ar |
| 47 | 0.01% | host203.201-252-149.telecom.net.ar |
| 12 | | m-komplekt.powernet.bg |
| 14 | | octopus.hopcount.ca |
| 20 | | mtl-hse-ppp172245.qc.sympatico.ca |
| 38 | 0.09% | ip-110-88.telesat.com.co |
| 18 | 0.04% | compaq.cable.net.co |
| 65 | 0.23% | corporativos_245171-35.etb.net.co |
| 31 | 0.08% | host86-136-94-142.range86-136.btcentralplus.com |
| 32 | 68.37% | crawl-66-249-65-8.googlebot.com |
| 25 | 0.06% | fwls134.us.infonet.com |
| 15 | | mail.ksaplus.com |
| 28 | 0.01% | sv-crawlfw3.looksmart.com |
| 25 | 0.16% | msnbot.msn.com |
| 22 | 0.01% | spider0.picsearch.com |
| 14 | | spider10.picsearch.com |
| 22 | 0.01% | spider11.picsearch.com |
| 40 | 0.01% | spider12.picsearch.com |
| 48 | 0.01% | spider13.picsearch.com |
| 18 | | spider2.picsearch.com |
| 14 | | spider3.picsearch.com |
| 33 | 0.15% | unity_mail.unityig-nyc.com |
| 288 | | monitord.uoregon.edu |
| 14 | 0.04% | host-245-108.greennet.gl |
| 19 | 0.02% | host-148-244-235-5.block.alestra.net.mx |
| 15 | 0.05% | bib-jefunid-uryt.unach.mx |
| 13 | | garcia.alt.net |
| 21 | 0.06% | 240-178-136-85.user.auna.net |
| 15 | 0.01% | cacher3.ericsson.net |
| 25 | 0.17% | 140.149.100-84.rev.gaoland.net |
| 12 | | 56.4.119-80.rev.gaoland.net |
| 51 | 0.76% | pttid31.integraonline.net |
| 37 | 0.01% | cust16202.lava.net |
| 12 | | mordor.mind.net |
| 14 | 0.18% | 80-58-35-170.proxycache.rima-tde.net |
| 21 | | radius-82-150-131-239.dsdeurne.nl |
| 26 | 0.01% | red.darkmere.gen.nz |
| 20 | 0.26% | client-201.230.38.123.speedy.net.pe |
| 13 | 0.04% | client-200.121.243.31.speedy.net.pe |
| 1249 | 28.11% | [not listed: 560 hosts] |
(Go To: Top | General Summary | Monthly Report | Weekly Report | Daily Report | Daily Summary | Hourly Summary | Domain Report | Organization Report | Host Report | Search Word Report | Operating System Report | Status Code Report | File Size Report | File Type Report | Directory Report | Failure Report | Request Report)
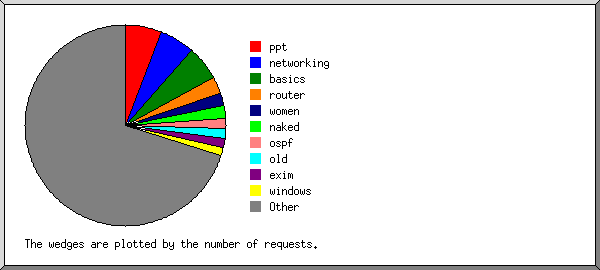
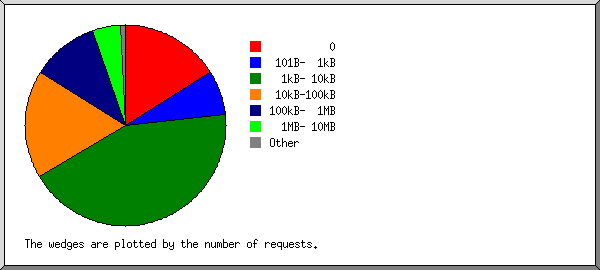
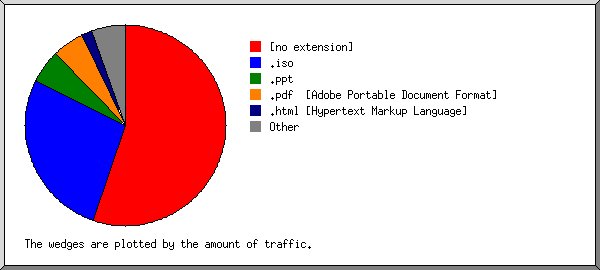
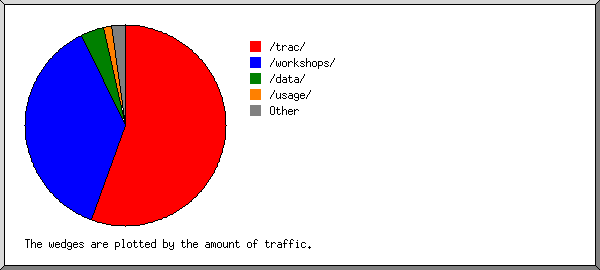
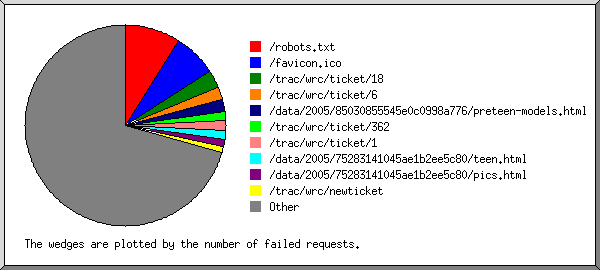
This report lists the files on the site.
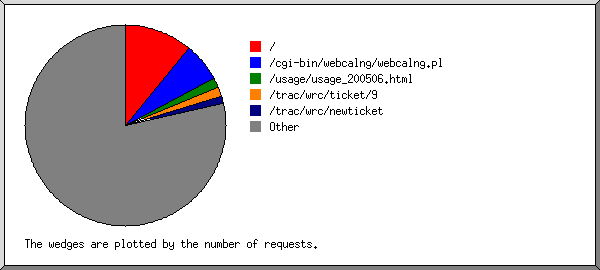
Listing files with at least 20 requests, sorted by the number of requests.
| #reqs | %bytes | last time | file |
|---|
| 320 | 0.03% | Nov/ 5/05 4:04 AM | / |
| 120 | 0.08% | Nov/ 5/05 3:41 AM | /archive/organizers/ |
| 101 | 0.45% | Nov/ 4/05 9:43 PM | /workshops/2004/CEDIA2/material/Arq_Resistente.pdf |
| 89 | 0.12% | Nov/ 4/05 2:43 PM | /workshops/2004/CEDIA2/material/Configuracion_Basica_Cisco.pdf |
| 83 | 0.33% | Nov/ 5/05 3:45 AM | /workshops/2004/CEDIA/presentaciones/cv/nat/Conceptos-NAT.pdf |
| 57 | 0.78% | Nov/ 4/05 8:17 PM | /workshops/2004/CEDIA/presentaciones/cv/seguridad/Wireless-Security.pdf |
| 43 | 0.12% | Nov/ 4/05 1:57 PM | /workshops/2004/CEDIA2/material/Enrutamiento_Estatico.pdf |
| 40 | 0.27% | Nov/ 5/05 4:02 AM | /workshops/2004/CEDIA/presentaciones/cv/switching/Switching-Ethernet.pdf |
| 35 | 0.16% | Nov/ 4/05 7:02 PM | /workshops/2004/CEDIA2/material/Direccionamiento_IP.pdf |
| 34 | 0.06% | Nov/ 4/05 4:43 PM | /workshops/2004/CEDIA2/material/Simulacion_Enrutamiento.pdf |
| 31 | 0.07% | Nov/ 5/05 4:02 AM | /data/2000/7965402764004e95ca159a/ciscocnf.ppt |
| 25 | 0.55% | Nov/ 4/05 12:14 PM | /workshops/2004/CEDIA2/material/IPv6.pdf |
| 25 | 0.12% | Nov/ 4/05 3:28 PM | /workshops/2004/CEDIA2/material/ixp-sp.pdf |
| 25 | 0.01% | Nov/ 5/05 1:14 AM | /helpfiles/workshop_info_main.php |
| 24 | 0.06% | Nov/ 4/05 5:08 PM | /workshops/2004/CEDIA2/material/intro.pdf |
| 22 | 0.19% | Nov/ 5/05 3:47 AM | /data/2003/145088522400b83f9b7630/ciscointro.ppt |
| 22 | 0.01% | Nov/ 5/05 4:02 AM | /archive/organizers/msg00001.html |
| 21 | | Nov/ 4/05 2:26 PM | /archive/organizers/msg00056.html |
| 20 | 0.01% | Nov/ 4/05 10:31 PM | /workshops/2004/ccTLD-bkk/day0/img/logo-fade.jpg |
| 1746 | 96.59% | Nov/ 5/05 4:02 AM | [not listed: 723 files] |
 Web Server Statistics for ISOC Workshop Resource Centre
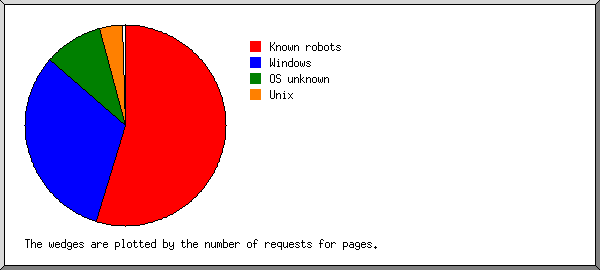
 ) represents 30 requests for pages or part thereof.