(Go To: Top | General Summary | Daily Report | Daily Summary | Hourly Summary | Domain Report | Organization Report | Host Report | Search Word Report | Operating System Report | Status Code Report | File Size Report | File Type Report | Directory Report | Failure Report | Request Report)
This report lists the countries of the computers which requested files.

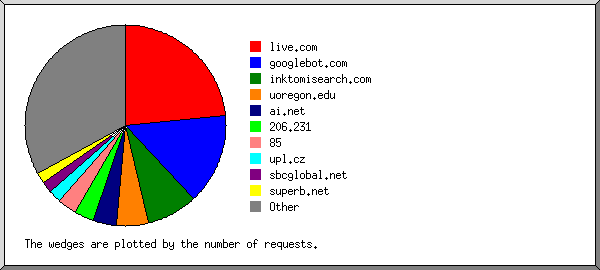
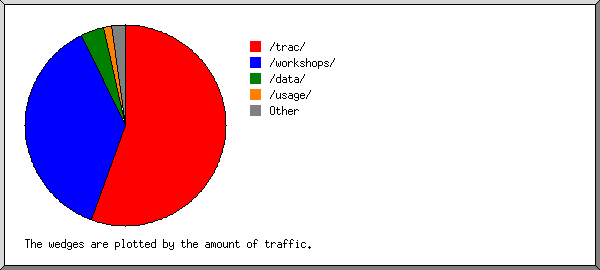
Listing domains, sorted by the amount of traffic.
| #reqs | %bytes | domain |
|---|
| 174 | 35.83% | .ec (Ecuador) |
| 130 | 17.42% | .cl (Chile) |
| 1011 | 13.40% | [unresolved numerical addresses] |
| 2144 | 12.45% | .com (Commercial) |
| 802 | 5.05% | .net (Networks) |
| 57 | 4.26% | .do (Dominican Republic) |
| 87 | 2.42% | .co (Colombia) |
| 183 | 2.22% | .mx (Mexico) |
| 82 | 1.73% | .es (Spain) |
| 58 | 1.37% | .pe (Peru) |
| 12 | 0.74% | .ma (Morocco) |
| 14 | 0.67% | .fr (France) |
| 9 | 0.34% | .au (Australia) |
| 11 | 0.27% | .ca (Canada) |
| 4 | 0.22% | .my (Malaysia) |
| 3 | 0.16% | .il (Israel) |
| 2 | 0.16% | .cd (Democratic Republic of the Congo) |
| 62 | 0.14% | [unknown domain] |
| 11 | 0.13% | .id (Indonesia) |
| 9 | 0.13% | .pl (Poland) |
| 18 | 0.12% | .uk (United Kingdom) |
| 49 | 0.11% | .py (Paraguay) |
| 39 | 0.09% | .br (Brazil) |
| 298 | 0.07% | .edu (US Higher Education) |
| 8 | 0.07% | .ar (Argentina) |
| 3 | 0.05% | .be (Belgium) |
| 14 | 0.04% | .pt (Portugal) |
| 15 | 0.04% | .de (Germany) |
| 11 | 0.04% | .org (Non Profit Making Organizations) |
| 8 | 0.04% | .in (India) |
| 12 | 0.03% | .nl (Netherlands) |
| 2 | 0.03% | .jp (Japan) |
| 6 | 0.03% | .sa (Saudi Arabia) |
| 4 | 0.03% | .hu (Hungary) |
| 21 | 0.01% | .gr (Greece) |
| 1 | 0.01% | .sg (Singapore) |
| 18 | 0.01% | .zw (Zimbabwe) |
| 3 | 0.01% | [domain not given] |
| 1 | 0.01% | .ru (Russia) |
| 1 | 0.01% | .ee (Estonia) |
| 1 | 0.01% | .se (Sweden) |
| 1 | | .dk (Denmark) |
| 3 | | .hk (Hong Kong) |
| 1 | | .tv (Tuvalu) |
| 1 | | .cy (Cyprus) |
| 1 | | .pk (Pakistan) |
| 1 | | .fi (Finland) |
| 1 | | .bn (Brunei Darussalam) |
| 1 | | .th (Thailand) |
| 1 | | .tr (Turkey) |
| 1 | | .it (Italy) |
| 1 | | .ve (Venezuela) |
| 1 | | .gov (US Government) |
| 1 | | .cz (Czech Republic) |
| 1 | | .eg (Egypt) |
| 4 | | .uy (Uruguay) |
| 1 | | .ro (Romania) |
| 4 | | .cu (Cuba) |
(Go To: Top | General Summary | Daily Report | Daily Summary | Hourly Summary | Domain Report | Organization Report | Host Report | Search Word Report | Operating System Report | Status Code Report | File Size Report | File Type Report | Directory Report | Failure Report | Request Report)
This report lists the computers which requested files.

Listing the top 50 hosts by the number of requests, sorted alphabetically.
| #reqs | %bytes | host |
|---|
| 48 | 0.03% | 63.245.111.234 |
| 47 | 0.01% | 132.248.75.41 |
| 41 | 0.02% | 132.248.203.4 |
| 16 | 0.12% | 200.21.240.71 |
| 48 | 0.03% | 200.48.92.156 |
| 52 | 0.09% | 200.121.69.210 |
| 40 | 0.03% | 200.125.65.25 |
| 38 | 0.01% | 200.173.151.2 |
| 40 | 0.03% | 201.54.48.6 |
| 54 | 0.03% | 201.211.90.97 |
| 20 | 1.20% | 201.228.4.176 |
| 16 | 0.16% | 216.104.206.15 |
| 120 | 17.26% | mail.salcobrand.cl |
| 20 | 0.35% | c647682-99.impsat.com.co |
| 17 | 0.17% | guasimal.ufps.edu.co |
| 18 | 0.31% | cable200-116-49-183.epm.net.co |
| 24 | 0.01% | host2.svx.edelman.com |
| 1287 | 4.39% | crawl-66-249-65-3.googlebot.com |
| 17 | 0.42% | nat01.medtronic.com |
| 215 | 0.46% | pc-194-104.san-damian4.pc.metropolis-inter.com |
| 139 | 1.38% | msnbot.msn.com |
| 50 | 1.88% | fw7-http.novartis.com |
| 18 | 0.09% | 84-121-240-7.onocable.ono.com |
| 78 | 0.05% | itpro.relc.com |
| 55 | 4.25% | 222sosua102.codetel.net.do |
| 52 | 0.17% | web-cache.espe.edu.ec |
| 121 | 35.62% | corp-200-105-233-27-uio.punto.net.ec |
| 290 | | monitord.uoregon.edu |
| 17 | 0.20% | bcnfwl02.retevision.es |
| 17 | 0.21% | proxima.cc.upv.es |
| 62 | 0.14% | bl1sch2042708.phx.gbl |
| 21 | 0.01% | ipd25.50.tellas.gr |
| 17 | 0.13% | dsl-201-133-127-102.prod-infinitum.com.mx |
| 20 | 0.45% | dsl-201-135-157-206.prod-infinitum.com.mx |
| 16 | 0.01% | dsl-201-138-68-251.prod-infinitum.com.mx |
| 37 | 0.26% | na-101-238.na.avantel.net.mx |
| 51 | 0.05% | adsl-152-137-110.asm.bellsouth.net |
| 17 | 0.22% | 200-109-71-97.genericrev.cantv.net |
| 20 | 0.02% | 200-44-126-202.genericrev.cantv.net |
| 21 | 0.02% | 66.112.109.155.dyn.centurytel.net |
| 16 | 0.04% | c-24-1-3-35.hsd1.tx.comcast.net |
| 67 | 0.07% | 213.red-81-32-191.dynamicip.rima-tde.net |
| 125 | 0.03% | 10.red-213-96-34.staticip.rima-tde.net |
| 17 | 0.09% | 253.red-80-38-248.staticip.rima-tde.net |
| 51 | 0.13% | ip-cust12011.telefonica-ca.net |
| 27 | 0.18% | 80-28-241-172.adsl.nuria.telefonica-data.net |
| 26 | 0.02% | ip37.marina-harbor.sfo.ygnition.net |
| 21 | 0.21% | client-201.240.19.204.speedy.net.pe |
| 46 | 0.03% | poderjudicial23.netvision.com.py |
| 18 | 0.01% | ip-net-216-104-199-5.africaonline.co.zw |
| 1712 | 28.89% | [not listed: 759 hosts] |
(Go To: Top | General Summary | Daily Report | Daily Summary | Hourly Summary | Domain Report | Organization Report | Host Report | Search Word Report | Operating System Report | Status Code Report | File Size Report | File Type Report | Directory Report | Failure Report | Request Report)
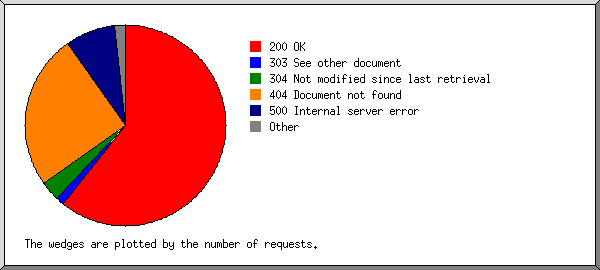
This report lists the files that caused failures, for example files not found.
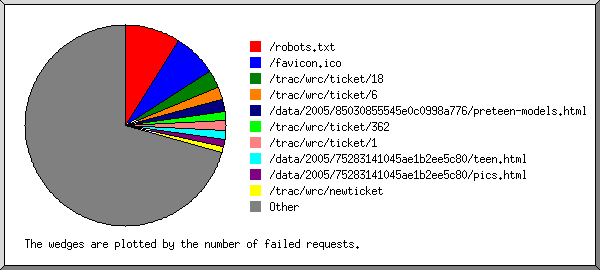
Listing files, sorted by the number of failed requests.
| #reqs | file |
|---|
| 335 | /favicon.ico |
| 149 | /robots.txt |
| 20 | /calendar/images/singlepix.gif |
| 16 | /images/singlepix.gif |
| 11 | /_vti_bin/shtml.exe/_vti_rpc |
| 11 | /_vti_inf.html |
| 11 | /organizers/images/singlepix.gif |
| 7 | /search/images/singlepix.gif |
| 6 | /workshops/2004/ccTLD-Amsterdam/dnssec/ISOC_tld_2004.pdf |
| 4 | /workshops/2005/SANOG-VI/ip-services.../mail/InternetMail.ho.pdf |
| 4 | /helpfiles/www.afrinic.net |
| 4 | /materials/images/singlepix.gif |
| 4 | /helpfiles/www.pacnog.org |
| 4 | /mailing/images/singlepix.gif |
| 3 | /helpfiles/www.ripe.net |
| 3 | /planning/images/singlepix.gif |
| 2 | /cgi-bin/wiki/pub/sn-cctld.pl |
| 2 | /workshops/2004/ccTLD-Amsterdam/http |
| 1 | /archive/operations/index.html#00050 |
| 1 | / |
| 1 | /resume/ |
| 1 | /workshops/2005/ccTLD-Nairobi/http |
| 1 | /helpfiles/www.apnic.net |
| 1 | /workshops/2004/CEDIA2/ou |
| 1 | /helpfiles/www.apricot.net |
| 1 | /helpfiles/www.mpls2006.com |
| 1 | /archive/operations/threads.html#00050 |
(Go To: Top | General Summary | Daily Report | Daily Summary | Hourly Summary | Domain Report | Organization Report | Host Report | Search Word Report | Operating System Report | Status Code Report | File Size Report | File Type Report | Directory Report | Failure Report | Request Report)
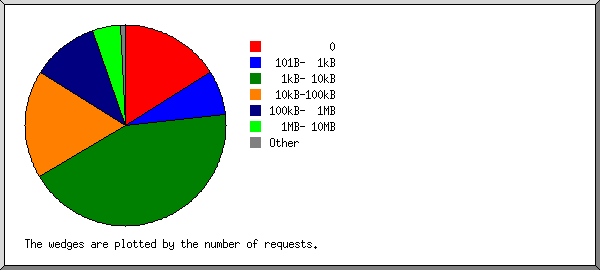
This report lists the files on the site.
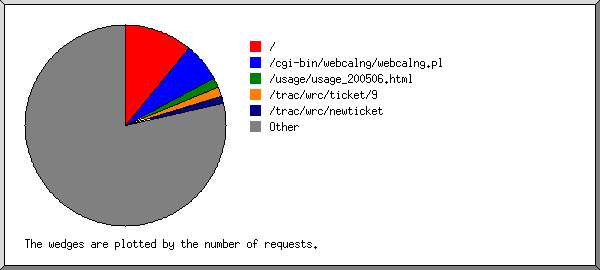
Listing files with at least 20 requests, sorted by the number of requests.
| #reqs | %bytes | last time | file |
|---|
| 737 | 2.45% | May/26/06 3:54 AM | /cgi-bin/webcalng/webcalng.pl |
| 380 | 0.20% | May/26/06 4:09 AM | / |
| 26 | 0.06% | May/26/06 4:09 AM | /?PHPSESSID=35d5f05cd14b40336cf5a4a7d211302c |
| 190 | 1.60% | May/26/06 2:36 AM | /workshops/2004/CEDIA2/material/Configuracion_Basica_Cisco.pdf |
| 94 | 0.92% | May/25/06 11:23 PM | /workshops/2004/CEDIA/presentaciones/cv/nat/Conceptos-NAT.pdf |
| 78 | 0.06% | May/26/06 2:55 AM | /helpfiles/workshop_info_main.php |
| 73 | 3.55% | May/26/06 12:00 AM | /workshops/2004/CEDIA/presentaciones/cv/seguridad/Wireless-Security.pdf |
| 73 | 1.81% | May/25/06 11:10 PM | /workshops/2004/CEDIA2/material/Arq_Resistente.pdf |
| 62 | 0.60% | May/25/06 8:12 PM | /workshops/2004/CEDIA/presentaciones/cv/intro/TCP-IP.pdf |
| 55 | 0.74% | May/25/06 7:20 PM | /workshops/2004/CEDIA2/material/Modulo_02a-OSPF_y_eBGP_basico_ipv6.pdf |
| 54 | 0.11% | May/26/06 3:50 AM | /archive/organizers/ |
| 54 | 1.06% | May/26/06 3:26 AM | /workshops/2004/CEDIA2/material/Modulo_01a-OSPF_iBGP_Basico_ipv6.pdf |
| 52 | 0.17% | May/25/06 3:03 PM | /workshops/2004/CEDIA2/material/ixp-sp.pdf |
| 52 | 1.12% | May/26/06 3:35 AM | /workshops/2004/CEDIA/presentaciones/cv/switching/Switching-Ethernet.pdf |
| 44 | 0.59% | May/25/06 4:16 PM | /workshops/2004/CEDIA2/material/Enrutamiento_Estatico.pdf |
| 34 | 0.17% | May/26/06 4:04 AM | /data/2000/7965402764004e95ca159a/ciscocnf.ppt |
| 30 | 0.50% | May/25/06 10:27 PM | /workshops/2004/CEDIA2/material/Introduccion_OSPF.pdf |
| 29 | 0.60% | May/26/06 2:21 AM | /data/2003/145088522400b83f9b7630/ciscointro.ppt |
| 29 | 0.27% | May/25/06 8:33 PM | /workshops/2004/CEDIA2/material/NOC.pdf |
| 26 | 0.34% | May/25/06 8:38 PM | /workshops/2004/CEDIA2/material/Simulacion_Enrutamiento.pdf |
| 26 | 0.08% | May/26/06 4:09 AM | /index.php |
| 25 | | May/25/06 11:39 PM | /images/navbar/home.gif |
| 25 | | May/25/06 11:39 PM | /images/navbar/planning_tools.gif |
| 25 | | May/25/06 11:39 PM | /images/navbar/workshop_organizers.gif |
| 25 | | May/25/06 11:39 PM | /images/pixel.gif |
| 25 | | May/25/06 11:39 PM | /images/navbar/instructors.gif |
| 25 | 0.01% | May/25/06 11:39 PM | /images/isoc_small.gif |
| 25 | | May/25/06 11:39 PM | /images/bk.gif |
| 25 | | May/25/06 11:39 PM | /images/navbar/educational_materials.gif |
| 24 | | May/25/06 11:39 PM | /images/navbar/search_and_site_map.gif |
| 23 | 1.25% | May/26/06 4:04 AM | /workshops/2004/ccTLD-bkk/day2/Reverse-DNS.pdf |
| 21 | 0.01% | May/25/06 6:58 PM | /workshops/2004/CEDIA/fotos/himg_4382-t.jpg |
| 21 | | May/25/06 11:39 PM | /images/spacer-4x1.gif |
| 20 | 0.01% | May/25/06 6:58 PM | /workshops/2004/CEDIA/fotos/himg_4454-t.jpg |
| 20 | | May/25/06 6:58 PM | /workshops/2004/CEDIA/fotos/himg_4387-t.jpg |
| 2922 | 81.76% | May/26/06 4:10 AM | [not listed: 1,142 files] |
 Web Server Statistics for ISOC Workshop Resource Centre
 ) represents 40 requests for pages or part thereof.