Program started on Sat, Jan 01 2011 at 4:53 AM.
Analyzed requests from Fri, Dec 31 2010 at 4:54 AM to Fri, Dec 31 2010 at 8:08 AM (0.13 days).
(Go To: Top | General Summary | Daily Report | Daily Summary | Hourly Summary | Domain Report | Organization Report | Host Report | Status Code Report | File Size Report | File Type Report | Directory Report | Failure Report | Request Report)
This report contains overall statistics.
Successful requests: 1,067
Average successful requests per day: 7,912
Successful requests for pages: 235
Average successful requests for pages per day: 1,736
Failed requests: 62
Redirected requests: 66
Distinct files requested: 725
Distinct hosts served: 121
Corrupt logfile lines: 1
Unwanted logfile entries: 80,947
Data transferred: 129.70 megabytes
Average data transferred per day: 962.69 megabytes
(Go To: Top | General Summary | Daily Report | Daily Summary | Hourly Summary | Domain Report | Organization Report | Host Report | Status Code Report | File Size Report | File Type Report | Directory Report | Failure Report | Request Report)
This report lists the activity in each day.
Each unit () represents 8 requests for pages or part thereof.
date | #reqs | #pages | |
---|---|---|---|
Dec/31/10 | 1067 | 235 |
Busiest day: Dec/31/10 (235 requests for pages).
(Go To: Top | General Summary | Daily Report | Daily Summary | Hourly Summary | Domain Report | Organization Report | Host Report | Status Code Report | File Size Report | File Type Report | Directory Report | Failure Report | Request Report)
This report lists the total activity for each day of the week, summed over all the weeks in the report.
Each unit () represents 6 requests for pages or part thereof.
day | #reqs | #pages | |
---|---|---|---|
Sun | 0 | 0 | |
Mon | 0 | 0 | |
Tue | 0 | 0 | |
Wed | 0 | 0 | |
Thu | 0 | 0 | |
Fri | 1067 | 235 | |
Sat | 0 | 0 |
(Go To: Top | General Summary | Daily Report | Daily Summary | Hourly Summary | Domain Report | Organization Report | Host Report | Status Code Report | File Size Report | File Type Report | Directory Report | Failure Report | Request Report)
This report lists the total activity for each hour of the day, summed over all the days in the report.
Each unit () represents 3 requests for pages or part thereof.
hour | #reqs | #pages | |
---|---|---|---|
0 | 0 | 0 | |
1 | 0 | 0 | |
2 | 0 | 0 | |
3 | 0 | 0 | |
4 | 24 | 7 | |
5 | 346 | 94 | |
6 | 355 | 63 | |
7 | 313 | 62 | |
8 | 29 | 9 | |
9 | 0 | 0 | |
10 | 0 | 0 | |
11 | 0 | 0 | |
12 | 0 | 0 | |
13 | 0 | 0 | |
14 | 0 | 0 | |
15 | 0 | 0 | |
16 | 0 | 0 | |
17 | 0 | 0 | |
18 | 0 | 0 | |
19 | 0 | 0 | |
20 | 0 | 0 | |
21 | 0 | 0 | |
22 | 0 | 0 | |
23 | 0 | 0 |
(Go To: Top | General Summary | Daily Report | Daily Summary | Hourly Summary | Domain Report | Organization Report | Host Report | Status Code Report | File Size Report | File Type Report | Directory Report | Failure Report | Request Report)
This report lists the countries of the computers which requested files.
Listing domains, sorted by the amount of traffic.
#reqs | %bytes | domain |
---|---|---|
133 | 32.47% | .net (Networks) |
150 | 26.73% | [unresolved numerical addresses] |
40 | 14.19% | .ma (Morocco) |
504 | 12.38% | .com (Commercial) |
8 | 4.74% | .fr (France) |
1 | 3.81% | .in (India) |
34 | 3.53% | .ru (Russia) |
12 | 0.44% | .nl (Netherlands) |
2 | 0.32% | .au (Australia) |
39 | 0.30% | .edu (US Higher Education) |
2 | 0.29% | .pl (Poland) |
11 | 0.29% | .es (Spain) |
29 | 0.23% | .ca (Canada) |
47 | 0.13% | .org (Non Profit Making Organizations) |
1 | 0.07% | .at (Austria) |
3 | 0.05% | .gr (Greece) |
3 | 0.01% | .sa (Saudi Arabia) |
2 | .id (Indonesia) | |
1 | .br (Brazil) | |
1 | .cn (China) | |
1 | .ro (Romania) | |
43 | .ua (Ukraine) |
(Go To: Top | General Summary | Daily Report | Daily Summary | Hourly Summary | Domain Report | Organization Report | Host Report | Status Code Report | File Size Report | File Type Report | Directory Report | Failure Report | Request Report)
This report lists the organizations of the computers which requested files.
Listing the top 20 organizations by the number of requests, sorted by the number of requests.
#reqs | %bytes | organization |
---|---|---|
440 | 8.56% | googlebot.com |
88 | 29.04% | yahoo.net |
45 | 0.10% | dotnetdotcom.org |
43 | org.ua | |
40 | 14.19% | ma |
39 | 0.30% | uoregon.edu |
33 | 3.43% | yandex.ru |
31 | 6.07% | 38 |
29 | 0.23% | owls.hopcount.ca |
27 | 0.12% | giga-dns.com |
26 | 0.09% | 68.169 |
16 | 0.03% | abac.net |
15 | 0.42% | rima-tde.net |
14 | 1.14% | msn.com |
11 | 0.29% | orange.es |
10 | 0.18% | rodecker.nl |
9 | 1.28% | 218.248 |
9 | 0.05% | 79 |
8 | 4.74% | wanadoo.fr |
6 | 0.05% | 62.68 |
128 | 29.70% | [not listed: 63 organizations] |
(Go To: Top | General Summary | Daily Report | Daily Summary | Hourly Summary | Domain Report | Organization Report | Host Report | Status Code Report | File Size Report | File Type Report | Directory Report | Failure Report | Request Report)
This report lists the computers which requested files.
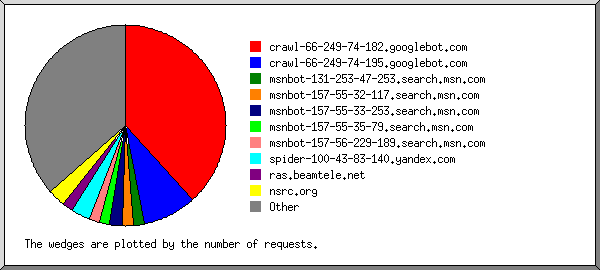
Listing the top 50 hosts by the number of requests, sorted alphabetically.
#reqs | %bytes | host |
---|---|---|
3 | 0.58% | 2.88.10.208 |
31 | 6.07% | 38.101.148.124 |
6 | 0.20% | 41.140.152.113 |
6 | 0.05% | 62.68.98.180 |
26 | 0.09% | 68.169.86.222 |
3 | 74.198.9.222 | |
9 | 0.05% | 79.142.67.147 |
4 | 0.04% | 80.12.110.203 |
5 | 0.42% | 91.212.226.140 |
4 | 2.44% | 114.143.48.56 |
2 | 121.18.127.91 | |
2 | 0.16% | 180.215.74.54 |
4 | 0.37% | 190.42.89.144 |
3 | 0.20% | 193.255.184.210 |
7 | 0.75% | 218.248.80.57 |
13 | 0.05% | dh26.r1.owls.hopcount.ca |
16 | 0.18% | dh16.r2.owls.hopcount.ca |
2 | 0.56% | 80-42-243-226.dynamic.dsl.as9105.com |
5 | 0.02% | 193.144.34.193.static.giga-dns.com |
3 | 0.01% | 101.145.34.193.static.giga-dns.com |
4 | 0.02% | 122.145.34.193.static.giga-dns.com |
5 | 0.02% | 98.179.143.79.static.giga-dns.com |
5 | 0.03% | 219.173.205.91.static.giga-dns.com |
5 | 0.02% | 54.173.205.91.static.giga-dns.com |
439 | 8.56% | crawl-66-249-68-4.googlebot.com |
2 | msnbot-207-46-13-88.search.msn.com | |
2 | 0.40% | 130-static.pacenet-india.com |
5 | 0.03% | 96.44.143.234.static.quadranet.com |
3 | 0.01% | hk2-lr680135g.super-goo.com |
39 | 0.30% | wirelessu-test.uoregon.edu |
6 | 0.01% | 91.pool85-54-142.dynamic.orange.es |
5 | 0.28% | 2.pool85-62-179.dynamic.orange.es |
3 | 0.28% | atoulouse-157-1-45-104.w86-201.abo.wanadoo.fr |
4 | 4.26% | amontpellier-256-1-93-95.w90-28.abo.wanadoo.fr |
3 | 0.05% | athedsl-411390.home.otenet.gr |
36 | 14.00% | adsl-37-211-192-81.adsl2.iam.net.ma |
4 | 0.19% | ll212-70-22-217-212.ll212.iam.net.ma |
16 | 0.03% | 69-64-84-80.dedicated.abac.net |
6 | 0.68% | c-24-147-137-106.hsd1.ma.comcast.net |
15 | 0.42% | 3.red-88-11-216.dynamicip.rima-tde.net |
2 | 0.36% | 67-9.vgccl.net |
88 | 29.04% | b3091307.crawl.yahoo.net |
10 | 0.18% | nienna.rodecker.nl |
45 | 0.10% | crawl9.dotnetdotcom.org |
2 | 0.04% | swan.lax.dns.icann.org |
7 | 0.02% | imparser07.yandex.ru |
26 | 3.41% | spider05.yandex.ru |
3 | 0.01% | cache9-4.ruh.isu.net.sa |
37 | s40.org.ua | |
6 | server37.org.ua | |
80 | 25.02% | [not listed: 71 hosts] |
(Go To: Top | General Summary | Daily Report | Daily Summary | Hourly Summary | Domain Report | Organization Report | Host Report | Status Code Report | File Size Report | File Type Report | Directory Report | Failure Report | Request Report)
This report lists the HTTP status codes of all requests.
Listing status codes, sorted numerically.
#reqs | status code |
---|---|
934 | 200 OK |
57 | 206 Partial content |
66 | 302 Document found elsewhere |
76 | 304 Not modified since last retrieval |
41 | 404 Document not found |
1 | 500 Internal server error |
20 | 503 Service temporarily unavailable |
(Go To: Top | General Summary | Daily Report | Daily Summary | Hourly Summary | Domain Report | Organization Report | Host Report | Status Code Report | File Size Report | File Type Report | Directory Report | Failure Report | Request Report)
This report lists the sizes of files.
size | #reqs | %bytes |
---|---|---|
0 | 121 | |
1B- 10B | 0 | |
11B- 100B | 9 | |
101B- 1kB | 42 | 0.01% |
1kB- 10kB | 266 | 0.87% |
10kB-100kB | 508 | 8.78% |
100kB- 1MB | 97 | 19.88% |
1MB- 10MB | 23 | 47.52% |
10MB-100MB | 1 | 22.93% |
(Go To: Top | General Summary | Daily Report | Daily Summary | Hourly Summary | Domain Report | Organization Report | Host Report | Status Code Report | File Size Report | File Type Report | Directory Report | Failure Report | Request Report)
This report lists the extensions of files.
Listing extensions with at least 0.1% of the traffic, sorted by the amount of traffic.
#reqs | %bytes | extension |
---|---|---|
131 | 54.90% | .pdf [Adobe Portable Document Format] |
50 | 27.46% | .ppt |
430 | 6.36% | .pl [Perl scripts] |
3 | 3.28% | .gz [Gzip compressed files] |
3 | 3.28% | .ps.gz [Gzipped PostScript] |
27 | 1.87% | .php [PHP] |
40 | 1.56% | .ics |
107 | 1.08% | .html [Hypertext Markup Language] |
121 | 0.83% | [directories] |
5 | 0.67% | .png [PNG graphics] |
1 | 0.46% | .pptx |
11 | 0.34% | .jpg [JPEG graphics] |
3 | 0.27% | .sxi |
5 | 0.20% | .doc [Microsoft Word document] |
6 | 0.18% | .txt [Plain text] |
2 | 0.15% | .odp |
45 | 0.13% | [no extension] |
1 | 0.10% | .ps [PostScript] |
79 | 0.15% | [not listed: 15 extensions] |
(Go To: Top | General Summary | Daily Report | Daily Summary | Hourly Summary | Domain Report | Organization Report | Host Report | Status Code Report | File Size Report | File Type Report | Directory Report | Failure Report | Request Report)
This report lists the directories from which files were requested. (The figures for each directory include all of its subdirectories.)
Listing directories with at least 0.01% of the traffic, sorted by the amount of traffic.
#reqs | %bytes | directory |
---|---|---|
150 | 52.25% | /data/ |
183 | 36.04% | /workshops/ |
474 | 6.49% | /cgi-bin/ |
6 | 1.69% | /materials/ |
45 | 1.65% | /calendar/ |
19 | 0.71% | /analog/ |
55 | 0.55% | /usage/ |
49 | 0.37% | [root directory] |
19 | 0.14% | /helpfiles/ |
46 | 0.07% | /images/ |
6 | 0.02% | /css/ |
15 | 0.02% | [not listed: 7 directories] |
(Go To: Top | General Summary | Daily Report | Daily Summary | Hourly Summary | Domain Report | Organization Report | Host Report | Status Code Report | File Size Report | File Type Report | Directory Report | Failure Report | Request Report)
This report lists the files that caused failures, for example files not found.
Listing files, sorted by the number of failed requests.
#reqs | file |
---|---|
24 | /favicon.ico |
21 | /cgi-bin/wiki/pub/pacnog3.pl |
12 | /robots.txt |
2 | /data/2006/1757635379448202b00a1f2/tool.gif |
1 | /pipermail/ams-cctld-students/mhonarc/ |
1 | /index-test.php |
1 | /workshops/2006/ccTLD-Samoa/iana-procedures-samoa-2006.pdf |
(Go To: Top | General Summary | Daily Report | Daily Summary | Hourly Summary | Domain Report | Organization Report | Host Report | Status Code Report | File Size Report | File Type Report | Directory Report | Failure Report | Request Report)
This report lists the files on the site.
Listing files with at least 20 requests, sorted by the number of requests.
#reqs | %bytes | last time | file |
---|---|---|---|
378 | 6.13% | Dec/31/10 8:07 AM | /cgi-bin/webcalng/webcalng.pl |
50 | 0.23% | Dec/31/10 8:04 AM | /cgi-bin/wiki/pub/pacnog3.pl |
48 | 0.22% | Dec/31/10 8:04 AM | /cgi-bin/wiki/pub/pacnog3.pl?action=edit;id=PacNOG_3_Meeting |
47 | 0.36% | Dec/31/10 8:05 AM | / |
43 | 0.12% | Dec/31/10 7:57 AM | /cgi-bin/wiki/pub/pacnog3.pl/PacNOG_3_Meeting |
43 | Dec/31/10 8:07 AM | /usage/usage_201010.html | |
31 | 0.39% | Dec/31/10 7:58 AM | /calendar/ical/wrc-upcoming.ics |
475 | 92.77% | Dec/31/10 8:08 AM | [not listed: 314 files] |