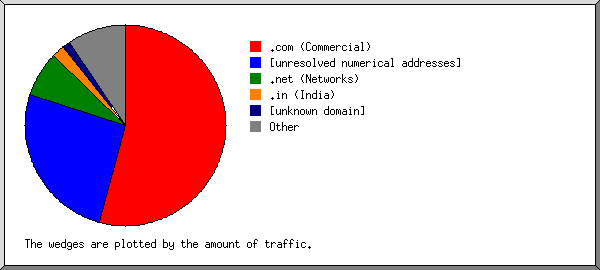
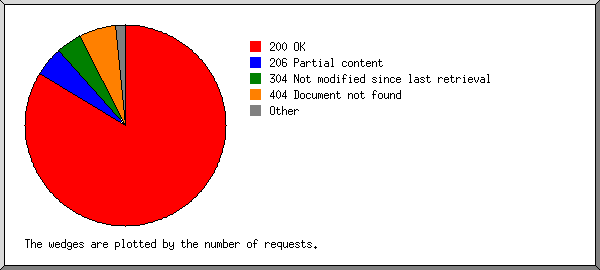
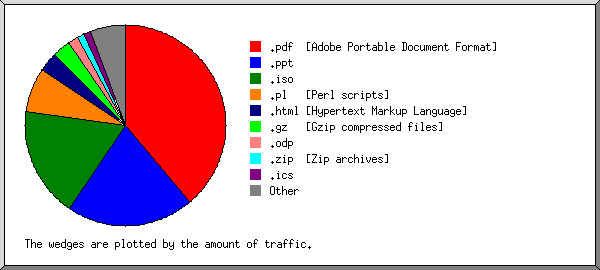
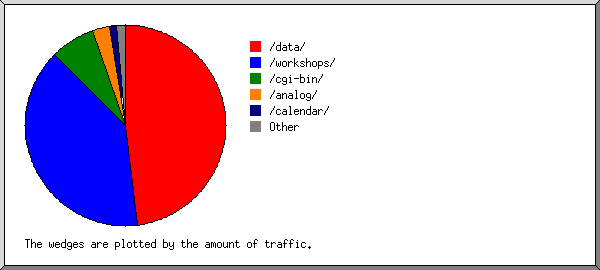
(Go To: Top | General Summary | Daily Report | Daily Summary | Hourly Summary | Domain Report | Organization Report | Host Report | Status Code Report | File Size Report | File Type Report | Directory Report | Failure Report | Request Report)
This report lists the computers which requested files.
Listing the top 50 hosts by the number of requests, sorted alphabetically.
| #reqs | %bytes | host |
|---|
| 10 | 0.09% | 41.204.143.224 |
| 2 | 0.14% | 41.227.96.68 |
| 3 | 0.32% | 41.227.231.14 |
| 1 | 0.54% | 61.135.249.216 |
| 1 | 0.02% | 74.125.46.91 |
| 1 | 0.01% | 82.137.208.59 |
| 2 | 8.59% | 88.87.197.154 |
| 1 | 0.21% | 115.248.139.194 |
| 3 | 0.76% | 117.196.247.45 |
| 10 | 2.94% | 117.226.164.138 |
| 4 | 5.87% | 144.160.226.53 |
| 3 | 0.07% | 145.228.88.149 |
| 1 | 0.27% | 157.55.17.79 |
| 5 | 2.54% | 184.105.173.27 |
| 2 | 0.47% | 186.46.95.210 |
| 2 | 6.06% | 212.221.35.62 |
| 3 | 1.96% | meridian.apexn.com.au |
| 6 | 0.05% | dh21.r1.hopcount.ca |
| 1 | 0.88% | ns.arkemagroup.com |
| 1 | 0.02% | baiduspider-123-125-71-103.crawl.baidu.com |
| 1 | 0.02% | baiduspider-220-181-108-181.crawl.baidu.com |
| 1 | | crawl15.exabot.com |
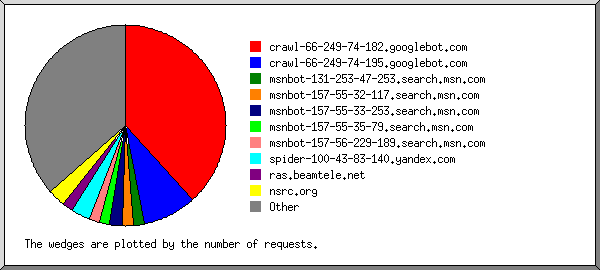
| 132 | 8.89% | crawl-66-249-68-118.googlebot.com |
| 11 | 0.48% | crawl-66-249-68-229.googlebot.com |
| 1 | 0.21% | pc146021.hknet.com |
| 2 | 0.54% | downside.llnw.com |
| 1 | 0.52% | msnbot-207-46-12-163.search.msn.com |
| 1 | 0.01% | msnbot-207-46-13-92.search.msn.com |
| 1 | 0.01% | msnbot-207-46-195-230.search.msn.com |
| 2 | 0.01% | msnbot-207-46-204-227.search.msn.com |
| 1 | | msnbot-65-52-108-59.search.msn.com |
| 4 | 0.15% | msnbot-65-52-110-20.search.msn.com |
| 1 | | msnbot-65-52-110-85.search.msn.com |
| 1 | 0.54% | 174.sub-75-246-193.myvzw.com |
| 2 | 6.66% | 110-234-52-2.del.tulipconnect.com |
| 1 | 0.02% | 208-115-111-71-reverse.wowrack.com |
| 1 | 0.07% | wmsquid1.wmgruppe.de |
| 12 | 0.28% | wirelessu-test.uoregon.edu |
| 2 | 2.57% | abts-kk-dynamic-236.135.172.122.airtelbroadband.in |
| 1 | 0.21% | abts-north-dynamic-138.227.177.122.airtelbroadband.in |
| 2 | 14.95% | dedi158-146.envisional.net |
| 2 | 0.62% | 178-33-40-168.ovh.net |
| 18 | 1.57% | 168.red-80-38-94.staticip.rima-tde.net |
| 37 | 3.06% | b3091098.crawl.yahoo.net |
| 58 | 11.18% | crawl9.dotnetdotcom.org |
| 1 | 0.03% | ibl50.internetdsl.tpnet.pl |
| 8 | | imparser07.yandex.ru |
| 5 | | spider05.yandex.ru |
| 2 | 1.54% | vpn.hi3gaccess.se |
| 61 | | 18-76-73-109.rackcentre.redstation.net.uk |
| 21 | 14.07% | [not listed: 21 hosts] |
 Web Server Statistics for ISOC Workshop Resource Centre
 ) represents 5 requests for pages or part thereof.