(Go To: Top | General Summary | Daily Report | Daily Summary | Hourly Summary | Domain Report | Organization Report | Host Report | Status Code Report | File Size Report | File Type Report | Directory Report | Failure Report | Request Report)
This report lists the computers which requested files.
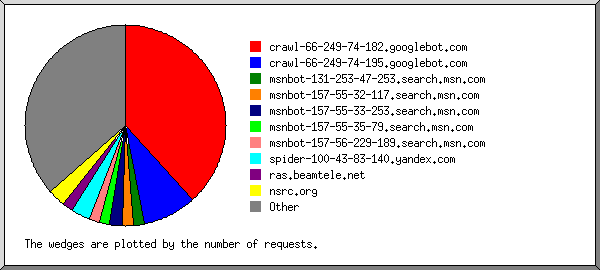
Listing the top 50 hosts by the number of requests, sorted alphabetically.
| #reqs | %bytes | host |
|---|
| 4 | 0.05% | 41.83.69.157 |
| 9 | 2.57% | 41.140.44.31 |
| 15 | 0.50% | 41.205.71.162 |
| 20 | 0.46% | 41.207.172.99 |
| 28 | 7.71% | 46.229.160.208 |
| 3 | 0.07% | 89.144.180.3 |
| 4 | 2.04% | 91.200.224.48 |
| 5 | 0.07% | 111.13.8.91 |
| 14 | 0.24% | 164.100.138.243 |
| 20 | 5.06% | 176.44.69.175 |
| 3 | 0.48% | 197.15.70.77 |
| 5 | 0.01% | 208.115.113.86 |
| 43 | 1.26% | 212.52.138.242 |
| 4 | 0.11% | 213.55.104.206 |
| 11 | | 220.118.206.164 |
| 19 | 0.16% | 220.181.124.179 |
| 3 | 0.07% | c122-107-58-207.blktn5.nsw.optusnet.com.au |
| 30 | 0.08% | dsl-202-173-147-216.qld.westnet.com.au |
| 3 | | baiduspider-180-76-5-185.crawl.baidu.com |
| 3 | | baiduspider-180-76-5-190.crawl.baidu.com |
| 3 | | baiduspider-180-76-5-54.crawl.baidu.com |
| 3 | | baiduspider-180-76-5-89.crawl.baidu.com |
| 3 | 0.01% | gw2.corpgw.com |
| 676 | 9.78% | crawl-66-249-67-239.googlebot.com |
| 1913 | 31.69% | crawl-66-249-68-33.googlebot.com |
| 3 | 0.05% | msnbot-157-55-16-229.search.msn.com |
| 6 | 0.79% | msnbot-157-55-17-195.search.msn.com |
| 4 | 0.55% | msnbot-207-46-13-115.search.msn.com |
| 3 | 0.43% | msnbot-207-46-13-48.search.msn.com |
| 5 | 0.25% | msnbot-207-46-204-191.search.msn.com |
| 3 | 1.23% | msnbot-65-52-104-84.search.msn.com |
| 12 | 0.04% | smtp01.twenga.com |
| 29 | 1.79% | dynamic.casap1-123-23-137-41.wanamaroc.com |
| 4 | 0.02% | 208-115-111-70-reverse.wowrack.com |
| 20 | 0.44% | spider-100-43-83-140.yandex.com |
| 8 | 3.82% | cloud-1.dima.tu-berlin.de |
| 4 | 0.61% | cloud-4.dima.tu-berlin.de |
| 3 | 0.48% | 81-67-224-199.rev.numericable.fr |
| 28 | 0.29% | aorleans-554-1-1-182.w92-152.abo.wanadoo.fr |
| 11 | 0.99% | 59.165.111.178.static-chennai.vsnl.net.in |
| 6 | 0.85% | 86.108.x.170.go.com.jo |
| 4 | 0.01% | 5.221.202.1.static.bjtelecom.net |
| 4 | 1.11% | c-67-161-25-247.hsd1.ca.comcast.net |
| 18 | 0.02% | c-98-234-42-34.hsd1.ca.comcast.net |
| 4 | 0.97% | 221-135-134-214.sify.net |
| 37 | 0.09% | p5ddb9412.dip.t-dialin.net |
| 12 | 0.52% | pd9fe927b.dip.t-dialin.net |
| 3 | 0.02% | d113155.upc-d.chello.nl |
| 5 | 0.05% | swan.lax.dns.icann.org |
| 68 | 0.26% | nsrc.org |
| 210 | 21.91% | [not listed: 169 hosts] |
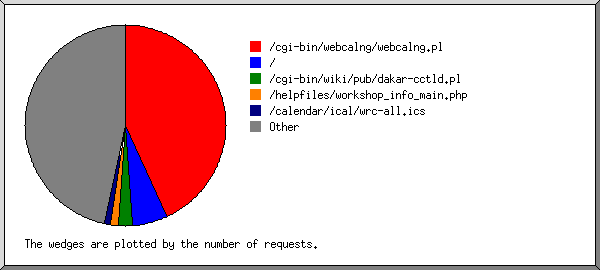
(Go To: Top | General Summary | Daily Report | Daily Summary | Hourly Summary | Domain Report | Organization Report | Host Report | Status Code Report | File Size Report | File Type Report | Directory Report | Failure Report | Request Report)
This report lists the files that caused failures, for example files not found.
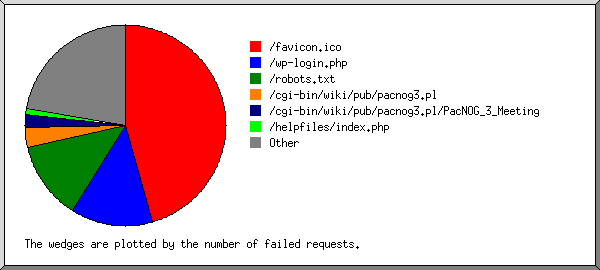
Listing files, sorted by the number of failed requests.
| #reqs | file |
|---|
| 40 | /favicon.ico |
| 23 | /robots.txt |
| 2 | /data/2000/113925681240073677d0fb5/ |
| 2 | /signup.php |
| 2 | /login.php |
| 2 | /_vti_bin/shtml.exe/_vti_rpc |
| 2 | /register/ |
| 2 | /_vti_inf.html |
| 1 | /data/2009/2464576964ac6082b984cb/documentacion... |
| 1 | /data/2005/8135015745dc6b408947b/blow.html |
| 1 | /minutes/prelim-report-04jun01.htm |
| 1 | / |
| 1 | /data/2005/8135015745dc6b408947b/men.html |
| 1 | /workshops/2005/ccTLD-Nairobi/day3/ianaforccs.ppt&ld=20120630&ap=7&app=1&c=info.dogpl |
| 1 | /data/2005/8135015745dc6b408947b/teens.html |
| 1 | /search/search-instructors.php |
| 1 | /workshops/2008/cctld-ams/Infrastructure/Documentation/DNSSEC_Key_maintenance.pdf |
| 1 | /general/policy.html |
| 1 | /workshops/2005/SANOG-VI/ip-services/day2/dns/Lab-exercise-4.pdf |
| 1 | /data/2005/75283141045ae1b2ee5c80/erotic.html |
| 1 | /data/2005/75283141045ae1b2ee5c80/tit.html |
| 1 | /modules/mod_wrapper/mod_wrapper.xml |
| 1 | /data/2005/8135015745dc6b408947b/young.html |
| 1 | /data/2009/3373933594ac5a074a7b04/analisis... |
| 1 | /general/ |
 Web Server Statistics for ISOC Workshop Resource Centre
 ) represents 8 requests for pages or part thereof.