Program started on Sun, Nov 01 2009 at 5:30 AM.
Analyzed requests from Sun, Nov 01 2009 at 4:58 AM to Sun, Nov 01 2009 at 5:30 AM (0.02 days).
(Go To: Top | General Summary | Monthly Report | Weekly Report | Daily Report | Daily Summary | Hourly Summary | Domain Report | Organization Report | Host Report | Status Code Report | File Size Report | File Type Report | Directory Report | Failure Report | Request Report)
This report contains overall statistics.
Successful requests: 128
Average successful requests per day: 5,715
Successful requests for pages: 71
Average successful requests for pages per day: 3,150
Failed requests: 8
Redirected requests: 1
Distinct files requested: 120
Distinct hosts served: 64
Data transferred: 8.54 megabytes
Average data transferred per day: 384.34 megabytes
(Go To: Top | General Summary | Monthly Report | Weekly Report | Daily Report | Daily Summary | Hourly Summary | Domain Report | Organization Report | Host Report | Status Code Report | File Size Report | File Type Report | Directory Report | Failure Report | Request Report)
This report lists the activity in each month.
Each unit () represents 2 requests for pages or part thereof.
month | #reqs | #pages | |
---|---|---|---|
Nov 2009 | 128 | 71 |
Busiest month: Nov 2009 (71 requests for pages).
(Go To: Top | General Summary | Monthly Report | Weekly Report | Daily Report | Daily Summary | Hourly Summary | Domain Report | Organization Report | Host Report | Status Code Report | File Size Report | File Type Report | Directory Report | Failure Report | Request Report)
This report lists the activity in each week.
Each unit () represents 2 requests for pages or part thereof.
week beg. | #reqs | #pages | |
---|---|---|---|
Nov/ 1/09 | 128 | 71 |
Busiest week: week beginning Nov/ 1/09 (71 requests for pages).
(Go To: Top | General Summary | Monthly Report | Weekly Report | Daily Report | Daily Summary | Hourly Summary | Domain Report | Organization Report | Host Report | Status Code Report | File Size Report | File Type Report | Directory Report | Failure Report | Request Report)
This report lists the activity in each day.
Each unit () represents 2 requests for pages or part thereof.
date | #reqs | #pages | |
---|---|---|---|
Nov/ 1/09 | 128 | 71 |
Busiest day: Nov/ 1/09 (71 requests for pages).
(Go To: Top | General Summary | Monthly Report | Weekly Report | Daily Report | Daily Summary | Hourly Summary | Domain Report | Organization Report | Host Report | Status Code Report | File Size Report | File Type Report | Directory Report | Failure Report | Request Report)
This report lists the total activity for each day of the week, summed over all the weeks in the report.
Each unit () represents 2 requests for pages or part thereof.
day | #reqs | #pages | |
---|---|---|---|
Sun | 128 | 71 | |
Mon | 0 | 0 | |
Tue | 0 | 0 | |
Wed | 0 | 0 | |
Thu | 0 | 0 | |
Fri | 0 | 0 | |
Sat | 0 | 0 |
(Go To: Top | General Summary | Monthly Report | Weekly Report | Daily Report | Daily Summary | Hourly Summary | Domain Report | Organization Report | Host Report | Status Code Report | File Size Report | File Type Report | Directory Report | Failure Report | Request Report)
This report lists the total activity for each hour of the day, summed over all the days in the report.
Each unit () represents 2 requests for pages or part thereof.
hour | #reqs | #pages | |
---|---|---|---|
0 | 0 | 0 | |
1 | 0 | 0 | |
2 | 0 | 0 | |
3 | 0 | 0 | |
4 | 3 | 3 | |
5 | 125 | 68 | |
6 | 0 | 0 | |
7 | 0 | 0 | |
8 | 0 | 0 | |
9 | 0 | 0 | |
10 | 0 | 0 | |
11 | 0 | 0 | |
12 | 0 | 0 | |
13 | 0 | 0 | |
14 | 0 | 0 | |
15 | 0 | 0 | |
16 | 0 | 0 | |
17 | 0 | 0 | |
18 | 0 | 0 | |
19 | 0 | 0 | |
20 | 0 | 0 | |
21 | 0 | 0 | |
22 | 0 | 0 | |
23 | 0 | 0 |
(Go To: Top | General Summary | Monthly Report | Weekly Report | Daily Report | Daily Summary | Hourly Summary | Domain Report | Organization Report | Host Report | Status Code Report | File Size Report | File Type Report | Directory Report | Failure Report | Request Report)
This report lists the countries of the computers which requested files.
Listing domains, sorted by the amount of traffic.
#reqs | %bytes | domain |
---|---|---|
28 | 62.75% | .net (Networks) |
88 | 25.94% | .com (Commercial) |
4 | 9.31% | [unresolved numerical addresses] |
3 | 0.86% | .nl (Netherlands) |
2 | 0.79% | .ma (Morocco) |
3 | 0.35% | .org (Non Profit Making Organizations) |
(Go To: Top | General Summary | Monthly Report | Weekly Report | Daily Report | Daily Summary | Hourly Summary | Domain Report | Organization Report | Host Report | Status Code Report | File Size Report | File Type Report | Directory Report | Failure Report | Request Report)
This report lists the organizations of the computers which requested files.
Listing organizations, sorted by the number of requests.
#reqs | %bytes | organization |
---|---|---|
53 | 1.28% | msn.com |
26 | 2.31% | googlebot.com |
20 | 14.45% | yahoo.net |
5 | 17.44% | exabot.com |
3 | 0.34% | t-dialin.net |
3 | 0.35% | nsrc.org |
3 | 0.86% | rodecker.nl |
2 | 65.55 | |
2 | 27.26% | optonline.net |
2 | 0.79% | ma |
2 | 0.24% | baidu.com |
2 | 4.68% | amazonaws.com |
1 | 4.93% | 64.76 |
1 | 18.46% | cantv.net |
1 | 4.38% | 123 |
1 | 0.05% | fti.net |
1 | 2.20% | comcast.net |
(Go To: Top | General Summary | Monthly Report | Weekly Report | Daily Report | Daily Summary | Hourly Summary | Domain Report | Organization Report | Host Report | Status Code Report | File Size Report | File Type Report | Directory Report | Failure Report | Request Report)
This report lists the computers which requested files.
Listing the top 50 hosts by the number of requests, sorted alphabetically.
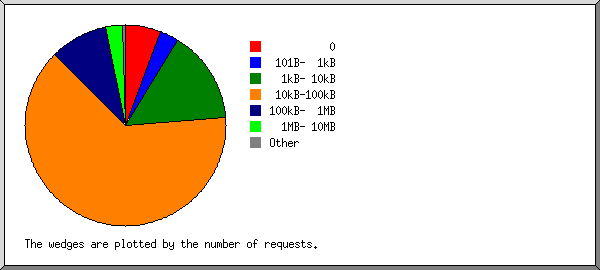
#reqs | %bytes | host |
---|---|---|
1 | 4.93% | 64.76.148.226 |
2 | 65.55.107.182 | |
1 | 4.38% | 123.49.42.131 |
1 | 0.02% | ec2-67-202-15-176.compute-1.amazonaws.com |
1 | 0.12% | baiduspider-220-181-7-123.crawl.baidu.com |
3 | crawl15.exabot.com | |
2 | 17.44% | crawl307.exabot.com |
26 | 2.31% | crawl-66-249-68-13.googlebot.com |
1 | 0.02% | msnbot-65-55-51-69.msn.com |
1 | msnbot-65-55-106-115.search.msn.com | |
1 | msnbot-65-55-106-131.search.msn.com | |
1 | msnbot-65-55-106-135.search.msn.com | |
1 | msnbot-65-55-106-136.search.msn.com | |
1 | msnbot-65-55-106-155.search.msn.com | |
1 | msnbot-65-55-106-156.search.msn.com | |
2 | 0.03% | msnbot-65-55-106-157.search.msn.com |
1 | msnbot-65-55-106-160.search.msn.com | |
1 | msnbot-65-55-106-161.search.msn.com | |
1 | 0.08% | msnbot-65-55-106-180.search.msn.com |
1 | msnbot-65-55-106-184.search.msn.com | |
2 | msnbot-65-55-106-185.search.msn.com | |
1 | msnbot-65-55-106-187.search.msn.com | |
1 | 0.06% | msnbot-65-55-106-206.search.msn.com |
1 | msnbot-65-55-106-208.search.msn.com | |
1 | msnbot-65-55-106-230.search.msn.com | |
1 | msnbot-65-55-106-231.search.msn.com | |
1 | msnbot-65-55-107-179.search.msn.com | |
2 | msnbot-65-55-207-101.search.msn.com | |
2 | msnbot-65-55-207-131.search.msn.com | |
1 | 0.11% | msnbot-65-55-207-133.search.msn.com |
1 | 0.04% | msnbot-65-55-207-47.search.msn.com |
1 | 0.01% | msnbot-65-55-207-69.search.msn.com |
1 | msnbot-65-55-207-70.search.msn.com | |
1 | 0.02% | msnbot-65-55-207-72.search.msn.com |
1 | msnbot-65-55-207-75.search.msn.com | |
2 | msnbot-65-55-207-94.search.msn.com | |
1 | 0.02% | msnbot-65-55-210-71.search.msn.com |
1 | 0.03% | msnbot-65-55-210-72.search.msn.com |
3 | 0.04% | msnbot-65-55-210-79.search.msn.com |
2 | 0.45% | msnbot-65-55-37-192.search.msn.com |
1 | 0.26% | msnbot-65-55-37-194.search.msn.com |
1 | msnbot-65-55-37-202.search.msn.com | |
2 | 0.79% | adsl196-165-134-206-196.adsl196-5.iam.net.ma |
1 | 2.20% | c-76-115-172-82.hsd1.wa.comcast.net |
1 | 0.05% | natcrawlbloc01-30.net.m1.fti.net |
2 | 27.26% | ool-4572e55f.dyn.optonline.net |
3 | 0.34% | p4fd8b6d8.dip.t-dialin.net |
20 | 14.45% | b3091124.crawl.yahoo.net |
3 | 0.86% | nienna.rodecker.nl |
3 | 0.35% | nsrc.org |
14 | 23.34% | [not listed: 14 hosts] |
(Go To: Top | General Summary | Monthly Report | Weekly Report | Daily Report | Daily Summary | Hourly Summary | Domain Report | Organization Report | Host Report | Status Code Report | File Size Report | File Type Report | Directory Report | Failure Report | Request Report)
This report lists the HTTP status codes of all requests.
Listing status codes, sorted numerically.
#reqs | status code |
---|---|
69 | 200 OK |
1 | 206 Partial content |
1 | 302 Document found elsewhere |
58 | 304 Not modified since last retrieval |
8 | 404 Document not found |
(Go To: Top | General Summary | Monthly Report | Weekly Report | Daily Report | Daily Summary | Hourly Summary | Domain Report | Organization Report | Host Report | Status Code Report | File Size Report | File Type Report | Directory Report | Failure Report | Request Report)
This report lists the sizes of files.
size | #reqs | %bytes |
---|---|---|
0 | 59 | |
1B- 10B | 0 | |
11B- 100B | 0 | |
101B- 1kB | 5 | 0.04% |
1kB- 10kB | 39 | 1.28% |
10kB-100kB | 14 | 3.69% |
100kB- 1MB | 7 | 31.87% |
1MB- 10MB | 4 | 63.13% |
(Go To: Top | General Summary | Monthly Report | Weekly Report | Daily Report | Daily Summary | Hourly Summary | Domain Report | Organization Report | Host Report | Status Code Report | File Size Report | File Type Report | Directory Report | Failure Report | Request Report)
This report lists the extensions of files.
Listing extensions with at least 0.1% of the traffic, sorted by the amount of traffic.
#reqs | %bytes | extension |
---|---|---|
21 | 62.66% | .pdf [Adobe Portable Document Format] |
1 | 18.46% | .pptx |
10 | 5.72% | .ppt |
5 | 5.25% | .ics |
3 | 4.69% | .txt [Plain text] |
32 | 1.55% | [directories] |
38 | 0.52% | .html [Hypertext Markup Language] |
1 | 0.42% | .xls |
2 | 0.39% | .jpeg [JPEG graphics] |
4 | 0.27% | .php [PHP] |
11 | 0.08% | [not listed: 8 extensions] |
(Go To: Top | General Summary | Monthly Report | Weekly Report | Daily Report | Daily Summary | Hourly Summary | Domain Report | Organization Report | Host Report | Status Code Report | File Size Report | File Type Report | Directory Report | Failure Report | Request Report)
This report lists the directories from which files were requested. (The figures for each directory include all of its subdirectories.)
Listing directories with at least 0.01% of the traffic, sorted by the amount of traffic.
#reqs | %bytes | directory |
---|---|---|
29 | 64.59% | /data/ |
73 | 28.84% | /workshops/ |
5 | 5.25% | /calendar/ |
6 | 0.63% | [root directory] |
2 | 0.42% | /planning/ |
2 | 0.13% | /mailing/ |
2 | 0.11% | /helpfiles/ |
1 | 0.02% | /scripts/ |
1 | 0.02% | /mailman/ |
7 | [not listed: 3 directories] |
(Go To: Top | General Summary | Monthly Report | Weekly Report | Daily Report | Daily Summary | Hourly Summary | Domain Report | Organization Report | Host Report | Status Code Report | File Size Report | File Type Report | Directory Report | Failure Report | Request Report)
This report lists the files that caused failures, for example files not found.
Listing files, sorted by the number of failed requests.
#reqs | file |
---|---|
3 | /robots.txt |
3 | /favicon.ico |
1 | /data/2005/8135015745dc6b408947b/sexy.html">solo |
1 | /workshops/2004/CEDIA/presentaciones/ha/seguridad/5FD068B0EF43B7B61265B392C76A753A_00000.temp0002.htm |
(Go To: Top | General Summary | Monthly Report | Weekly Report | Daily Report | Daily Summary | Hourly Summary | Domain Report | Organization Report | Host Report | Status Code Report | File Size Report | File Type Report | Directory Report | Failure Report | Request Report)
This report lists the files on the site.
Listing files with at least 20 requests, sorted by the number of requests.
#reqs | %bytes | last time | file |
---|---|---|---|
128 | 100% | Nov/ 1/09 5:30 AM | [not listed: 118 files] |