(Go To: Top | General Summary | Monthly Report | Weekly Report | Daily Report | Daily Summary | Hourly Summary | Domain Report | Organization Report | Host Report | Status Code Report | File Size Report | File Type Report | Directory Report | Failure Report | Request Report)
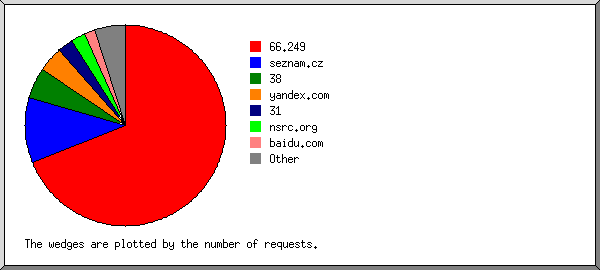
This report lists the computers which requested files.
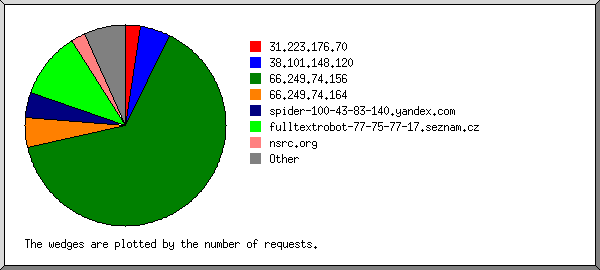
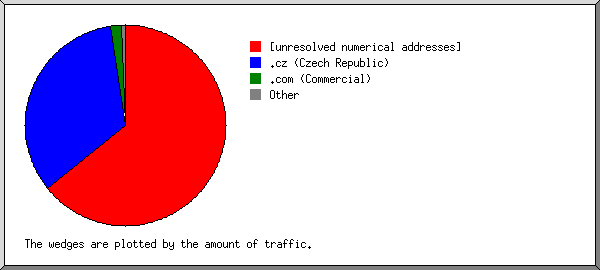
Listing hosts, sorted alphabetically.
| #reqs | %bytes | host |
|---|
| 1 | 0.26% | 61.135.168.39 |
| 14 | 0.67% | 115.69.159.200 |
| 1 | 17.26% | 196.20.81.30 |
| 1 | 1.84% | 213.55.95.61 |
| 1 | 0.71% | 213.186.160.67 |
| 1 | 0.89% | 219.142.53.27 |
| 1 | 0.26% | 220.181.32.22 |
| 1 | 3.91% | 64-103-25-233.cisco.com |
| 3 | 0.37% | crawl-5.cuill.com |
| 13 | 46.41% | crawl-66-249-73-148.googlebot.com |
| 1 | | msnbot-65-55-51-33.msn.com |
| 1 | 0.21% | msnbot-65-55-105-11.search.msn.com |
| 1 | 0.12% | msnbot-65-55-106-145.search.msn.com |
| 1 | 0.03% | msnbot-65-55-106-158.search.msn.com |
| 1 | 0.04% | msnbot-65-55-106-172.search.msn.com |
| 1 | | msnbot-65-55-210-68.search.msn.com |
| 4 | 0.28% | msnbot-65-55-210-73.search.msn.com |
| 3 | | crawl1.nat.svl.searchme.com |
| 2 | 0.49% | server11.servera.info |
| 2 | 6.70% | 62-6-178-69.static.gci.net |
| 2 | 0.22% | llf320057.crawl.yahoo.net |
| 5 | 4.52% | llf531093.crawl.yahoo.net |
| 1 | 0.61% | nienna.rodecker.nl |
| 10 | 4.00% | crawl6.dotnetdotcom.org |
| 2 | 10.20% | proxy.habari.co.tz |
 Web Server Statistics for ISOC Workshop Resource Centre
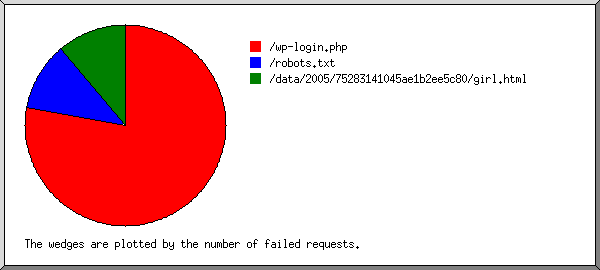
 ) represents 1 request for a page.