(Go To: Top | General Summary | Monthly Report | Weekly Report | Daily Report | Daily Summary | Hourly Summary | Domain Report | Organization Report | Host Report | Status Code Report | File Size Report | File Type Report | Directory Report | Failure Report | Request Report)
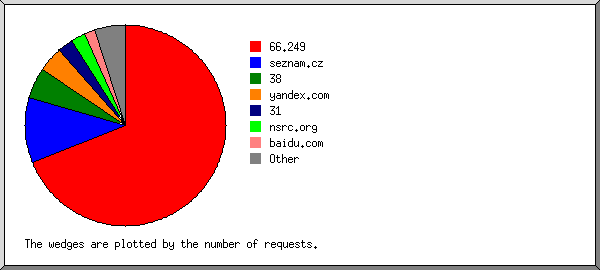
This report lists the computers which requested files.
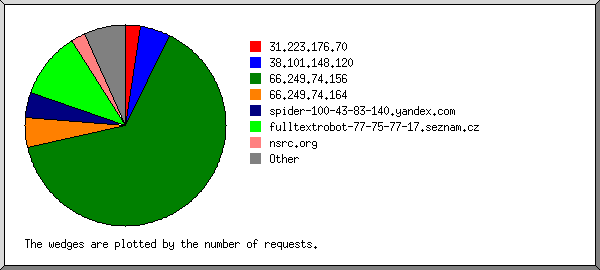
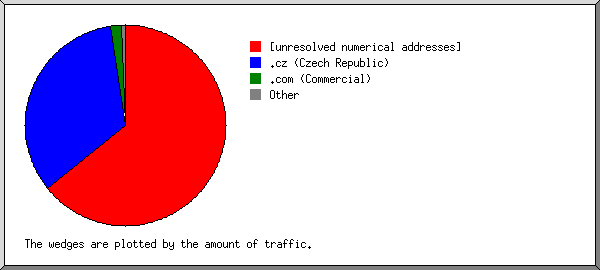
Listing hosts, sorted alphabetically.
| #reqs | %bytes | host |
|---|
| 2 | 0.31% | 38.101.148.126 |
| 5 | 77.00% | 65.55.217.54 |
| 2 | 2.99% | 217.11.25.55 |
| 6 | 3.65% | crawl-66-249-68-7.googlebot.com |
| 1 | 0.03% | msnbot-65-55-51-70.msn.com |
| 2 | | msnbot-65-55-106-133.search.msn.com |
| 1 | 0.08% | msnbot-65-55-106-136.search.msn.com |
| 1 | | msnbot-65-55-106-159.search.msn.com |
| 1 | | msnbot-65-55-106-161.search.msn.com |
| 2 | | msnbot-65-55-106-204.search.msn.com |
| 1 | 0.08% | msnbot-65-55-106-207.search.msn.com |
| 1 | 0.02% | msnbot-65-55-106-211.search.msn.com |
| 1 | 0.78% | msnbot-65-55-106-229.search.msn.com |
| 1 | 0.04% | msnbot-65-55-207-100.search.msn.com |
| 1 | | msnbot-65-55-207-133.search.msn.com |
| 1 | | msnbot-65-55-207-138.search.msn.com |
| 1 | | msnbot-65-55-207-27.search.msn.com |
| 1 | | msnbot-65-55-207-28.search.msn.com |
| 1 | | msnbot-65-55-207-46.search.msn.com |
| 1 | | msnbot-65-55-207-76.search.msn.com |
| 2 | 0.20% | msnbot-65-55-207-77.search.msn.com |
| 1 | | msnbot-65-55-207-93.search.msn.com |
| 1 | | msnbot-65-55-207-97.search.msn.com |
| 1 | | msnbot-65-55-207-99.search.msn.com |
| 1 | 0.03% | msnbot-65-55-230-229.search.msn.com |
| 1 | 0.13% | 173.99.220.87.dynamic.jazztel.es |
| 6 | 10.21% | b3090827.crawl.yahoo.net |
| 6 | 4.00% | llf531050.crawl.yahoo.net |
| 2 | 0.45% | nsrc.org |
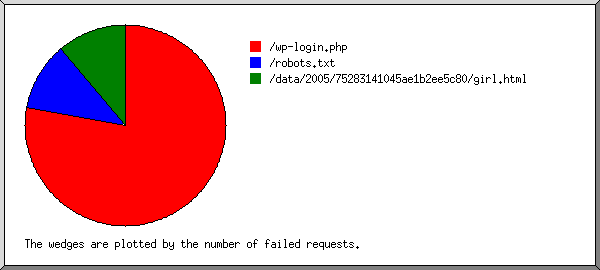
 Web Server Statistics for ISOC Workshop Resource Centre
 ) represents 1 request for a page.