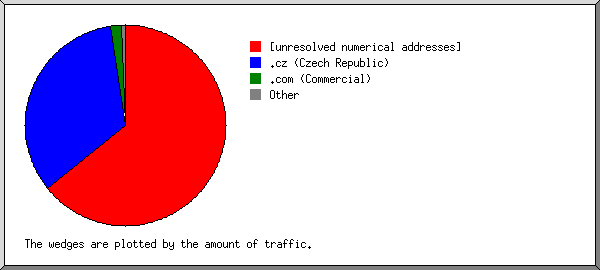
(Go To: Top | General Summary | Monthly Report | Weekly Report | Daily Report | Daily Summary | Hourly Summary | Domain Report | Organization Report | Host Report | Status Code Report | File Size Report | File Type Report | Directory Report | Failure Report | Request Report)
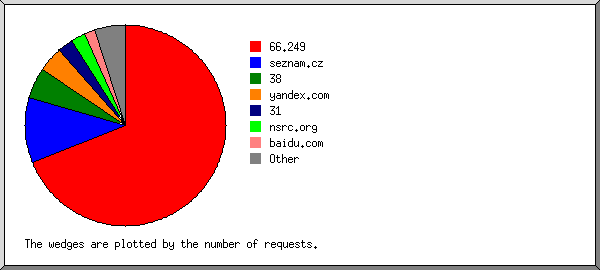
This report lists the computers which requested files.
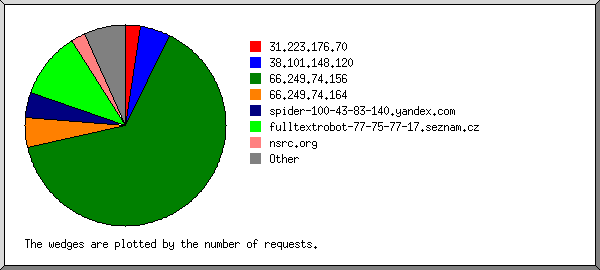
Listing hosts, sorted alphabetically.
| #reqs | %bytes | host |
|---|
| 1 | | 64.233.182.80 |
| 1 | 0.04% | 64.233.182.81 |
| 1 | | 64.233.182.82 |
| 3 | 0.01% | 64.233.182.83 |
| 1 | | 180.76.5.139 |
| 1 | | 220.181.125.69 |
| 12 | 2.21% | crawl-66-249-67-165.googlebot.com |
| 54 | 10.22% | crawl-66-249-68-89.googlebot.com |
| 1 | 0.07% | msnbot-207-46-13-100.search.msn.com |
| 3 | 2.08% | dynamic.rabatp1-39-59-137-41.wanamaroc.com |
| 2 | 0.19% | wirelessu-test.uoregon.edu |
| 1 | 3.92% | sd-28013.dedibox.fr |
| 1 | 0.07% | crawl-b05-s2.voilabot.orange.fr |
| 1 | 48.76% | abts-tn-dynamic-196.105.174.122.airtelbroadband.in |
| 7 | 0.98% | static-191.203.99.14.tataidc.co.in |
| 1 | 12.77% | 061196165242.cidr.odn.ne.jp |
| 23 | 4.66% | c-24-147-137-106.hsd1.ma.comcast.net |
| 5 | 1.11% | b3091098.crawl.yahoo.net |
| 1 | | imparser07.yandex.ru |
| 1 | 12.88% | spider81.yandex.ru |
| 1 | 0.01% | static-88.131.106.22.addr.tdc.se |
 Web Server Statistics for ISOC Workshop Resource Centre
 ) represents 1 request for a page.