Program started on Sun, May 13 2012 at 5:10 AM.
Analyzed requests from Sun, May 13 2012 at 4:55 AM to Sun, May 13 2012 at 5:10 AM (0.01 days).
(Go To: Top | General Summary | Monthly Report | Weekly Report | Daily Report | Daily Summary | Hourly Summary | Domain Report | Organization Report | Host Report | Status Code Report | File Size Report | File Type Report | Directory Report | Failure Report | Request Report)
This report contains overall statistics.
Successful requests: 122
Successful requests for pages: 31
Failed requests: 9
Redirected requests: 1
Distinct files requested: 112
Distinct hosts served: 20
Data transferred: 33.92 megabytes
(Go To: Top | General Summary | Monthly Report | Weekly Report | Daily Report | Daily Summary | Hourly Summary | Domain Report | Organization Report | Host Report | Status Code Report | File Size Report | File Type Report | Directory Report | Failure Report | Request Report)
This report lists the activity in each month.
Each unit () represents 1 request for a page.
month | #reqs | #pages | |
---|---|---|---|
May 2012 | 122 | 31 |
Busiest month: May 2012 (31 requests for pages).
(Go To: Top | General Summary | Monthly Report | Weekly Report | Daily Report | Daily Summary | Hourly Summary | Domain Report | Organization Report | Host Report | Status Code Report | File Size Report | File Type Report | Directory Report | Failure Report | Request Report)
This report lists the activity in each week.
Each unit () represents 1 request for a page.
week beg. | #reqs | #pages | |
---|---|---|---|
May/13/12 | 122 | 31 |
Busiest week: week beginning May/13/12 (31 requests for pages).
(Go To: Top | General Summary | Monthly Report | Weekly Report | Daily Report | Daily Summary | Hourly Summary | Domain Report | Organization Report | Host Report | Status Code Report | File Size Report | File Type Report | Directory Report | Failure Report | Request Report)
This report lists the activity in each day.
Each unit () represents 1 request for a page.
date | #reqs | #pages | |
---|---|---|---|
May/13/12 | 122 | 31 |
Busiest day: May/13/12 (31 requests for pages).
(Go To: Top | General Summary | Monthly Report | Weekly Report | Daily Report | Daily Summary | Hourly Summary | Domain Report | Organization Report | Host Report | Status Code Report | File Size Report | File Type Report | Directory Report | Failure Report | Request Report)
This report lists the total activity for each day of the week, summed over all the weeks in the report.
Each unit () represents 1 request for a page.
day | #reqs | #pages | |
---|---|---|---|
Sun | 122 | 31 | |
Mon | 0 | 0 | |
Tue | 0 | 0 | |
Wed | 0 | 0 | |
Thu | 0 | 0 | |
Fri | 0 | 0 | |
Sat | 0 | 0 |
(Go To: Top | General Summary | Monthly Report | Weekly Report | Daily Report | Daily Summary | Hourly Summary | Domain Report | Organization Report | Host Report | Status Code Report | File Size Report | File Type Report | Directory Report | Failure Report | Request Report)
This report lists the total activity for each hour of the day, summed over all the days in the report.
Each unit () represents 1 request for a page.
hour | #reqs | #pages | |
---|---|---|---|
0 | 0 | 0 | |
1 | 0 | 0 | |
2 | 0 | 0 | |
3 | 0 | 0 | |
4 | 40 | 15 | |
5 | 82 | 16 | |
6 | 0 | 0 | |
7 | 0 | 0 | |
8 | 0 | 0 | |
9 | 0 | 0 | |
10 | 0 | 0 | |
11 | 0 | 0 | |
12 | 0 | 0 | |
13 | 0 | 0 | |
14 | 0 | 0 | |
15 | 0 | 0 | |
16 | 0 | 0 | |
17 | 0 | 0 | |
18 | 0 | 0 | |
19 | 0 | 0 | |
20 | 0 | 0 | |
21 | 0 | 0 | |
22 | 0 | 0 | |
23 | 0 | 0 |
(Go To: Top | General Summary | Monthly Report | Weekly Report | Daily Report | Daily Summary | Hourly Summary | Domain Report | Organization Report | Host Report | Status Code Report | File Size Report | File Type Report | Directory Report | Failure Report | Request Report)
This report lists the countries of the computers which requested files.
Listing domains, sorted by the amount of traffic.
#reqs | %bytes | domain |
---|---|---|
35 | 77.37% | .de (Germany) |
22 | 13.35% | [unresolved numerical addresses] |
56 | 5.99% | .com (Commercial) |
3 | 1.91% | .in (India) |
2 | 1.29% | .net (Networks) |
4 | 0.09% | .org (Non Profit Making Organizations) |
(Go To: Top | General Summary | Monthly Report | Weekly Report | Daily Report | Daily Summary | Hourly Summary | Domain Report | Organization Report | Host Report | Status Code Report | File Size Report | File Type Report | Directory Report | Failure Report | Request Report)
This report lists the organizations of the computers which requested files.
Listing organizations, sorted by the number of requests.
#reqs | %bytes | organization |
---|---|---|
46 | 5.76% | googlebot.com |
35 | 77.37% | serverloft.de |
17 | 0.38% | 212.60 |
4 | 0.18% | baidu.com |
4 | 0.02% | msn.com |
3 | 4.50% | 197.1 |
3 | 1.91% | mtnl.net.in |
3 | 0.09% | nsrc.org |
2 | 1.29% | vizadanetworks.net |
1 | afnog.org | |
1 | 7.71% | 41 |
1 | 0.03% | yandex.com |
1 | 0.76% | 117 |
1 | 0.01% | wowrack.com |
(Go To: Top | General Summary | Monthly Report | Weekly Report | Daily Report | Daily Summary | Hourly Summary | Domain Report | Organization Report | Host Report | Status Code Report | File Size Report | File Type Report | Directory Report | Failure Report | Request Report)
This report lists the computers which requested files.
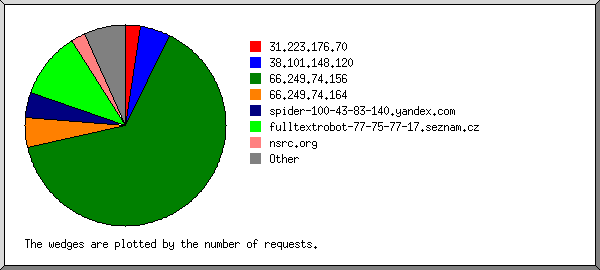
Listing hosts, sorted alphabetically.
#reqs | %bytes | host |
---|---|---|
1 | 7.71% | 41.58.2.79 |
1 | 0.76% | 117.196.5.147 |
3 | 4.50% | 197.1.242.134 |
17 | 0.38% | 212.60.89.2 |
1 | baiduspider-180-76-5-101.crawl.baidu.com | |
1 | baiduspider-180-76-5-58.crawl.baidu.com | |
1 | 0.09% | baiduspider-180-76-5-89.crawl.baidu.com |
1 | 0.09% | baiduspider-180-76-5-92.crawl.baidu.com |
8 | 0.43% | crawl-66-249-68-229.googlebot.com |
38 | 5.33% | crawl-66-249-68-33.googlebot.com |
1 | msnbot-157-55-112-204.search.msn.com | |
1 | msnbot-207-46-13-101.search.msn.com | |
2 | 0.01% | msnbot-207-46-192-45.search.msn.com |
1 | 0.01% | 208-115-111-70-reverse.wowrack.com |
1 | 0.03% | spider-100-43-83-140.yandex.com |
35 | 77.37% | loft7926.serverloft.de |
3 | 1.91% | triband-mum-120.62.41.31.mtnl.net.in |
2 | 1.29% | 201.185-50-182.silk.vizadanetworks.net |
1 | noc.mtg.afnog.org | |
3 | 0.09% | nsrc.org |
(Go To: Top | General Summary | Monthly Report | Weekly Report | Daily Report | Daily Summary | Hourly Summary | Domain Report | Organization Report | Host Report | Status Code Report | File Size Report | File Type Report | Directory Report | Failure Report | Request Report)
This report lists the HTTP status codes of all requests.
Listing status codes, sorted numerically.
#reqs | status code |
---|---|
113 | 200 OK |
4 | 206 Partial content |
1 | 302 Document found elsewhere |
5 | 304 Not modified since last retrieval |
9 | 404 Document not found |
(Go To: Top | General Summary | Monthly Report | Weekly Report | Daily Report | Daily Summary | Hourly Summary | Domain Report | Organization Report | Host Report | Status Code Report | File Size Report | File Type Report | Directory Report | Failure Report | Request Report)
This report lists the sizes of files.
size | #reqs | %bytes |
---|---|---|
0 | 6 | |
1B- 10B | 0 | |
11B- 100B | 3 | |
101B- 1kB | 8 | 0.01% |
1kB- 10kB | 31 | 0.43% |
10kB-100kB | 53 | 3.83% |
100kB- 1MB | 13 | 14.62% |
1MB- 10MB | 7 | 47.35% |
10MB-100MB | 1 | 33.77% |
(Go To: Top | General Summary | Monthly Report | Weekly Report | Daily Report | Daily Summary | Hourly Summary | Domain Report | Organization Report | Host Report | Status Code Report | File Size Report | File Type Report | Directory Report | Failure Report | Request Report)
This report lists the extensions of files.
Listing extensions with at least 0.1% of the traffic, sorted by the amount of traffic.
#reqs | %bytes | extension |
---|---|---|
16 | 67.67% | .pdf [Adobe Portable Document Format] |
4 | 18.19% | .pptx |
4 | 9.76% | .ppt |
44 | 3.33% | .pl [Perl scripts] |
21 | 0.67% | [directories] |
9 | 0.24% | .php [PHP] |
24 | 0.14% | [not listed: 8 extensions] |
(Go To: Top | General Summary | Monthly Report | Weekly Report | Daily Report | Daily Summary | Hourly Summary | Domain Report | Organization Report | Host Report | Status Code Report | File Size Report | File Type Report | Directory Report | Failure Report | Request Report)
This report lists the directories from which files were requested. (The figures for each directory include all of its subdirectories.)
Listing directories with at least 0.01% of the traffic, sorted by the amount of traffic.
#reqs | %bytes | directory |
---|---|---|
21 | 91.47% | /data/ |
28 | 4.57% | /workshops/ |
44 | 3.33% | /cgi-bin/ |
2 | 0.24% | /calendar/ |
6 | 0.16% | /helpfiles/ |
4 | 0.09% | [root directory] |
11 | 0.05% | /images/ |
1 | 0.03% | /wikis/ |
1 | 0.02% | /css/ |
1 | 0.02% | /search/ |
1 | 0.01% | /materials/ |
2 | [not listed: 1 directory] |
(Go To: Top | General Summary | Monthly Report | Weekly Report | Daily Report | Daily Summary | Hourly Summary | Domain Report | Organization Report | Host Report | Status Code Report | File Size Report | File Type Report | Directory Report | Failure Report | Request Report)
This report lists the files that caused failures, for example files not found.
Listing files, sorted by the number of failed requests.
#reqs | file |
---|---|
3 | /cgi-bin/wiki/pub/pacnog3.pl |
2 | /favicon.ico |
2 | /cgi-bin/wiki/pub/pacnog3.pl/PacNOG_3_Meeting |
1 | /workshops/2006/PacNOG2/track1/day1/freebsd/www.suse.com |
1 | /data/2005/8135015745dc6b408947b/galleries.html |
(Go To: Top | General Summary | Monthly Report | Weekly Report | Daily Report | Daily Summary | Hourly Summary | Domain Report | Organization Report | Host Report | Status Code Report | File Size Report | File Type Report | Directory Report | Failure Report | Request Report)
This report lists the files on the site.
Listing files with at least 20 requests, sorted by the number of requests.
#reqs | %bytes | last time | file |
---|---|---|---|
44 | 3.33% | May/13/12 5:09 AM | /cgi-bin/webcalng/webcalng.pl |
78 | 96.67% | May/13/12 5:10 AM | [not listed: 64 files] |