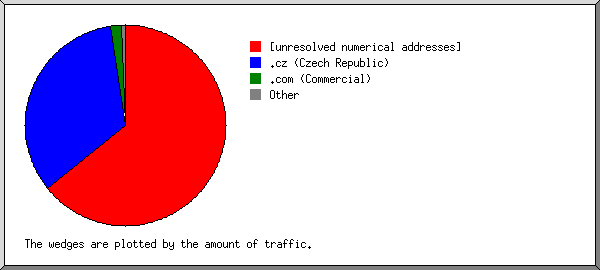
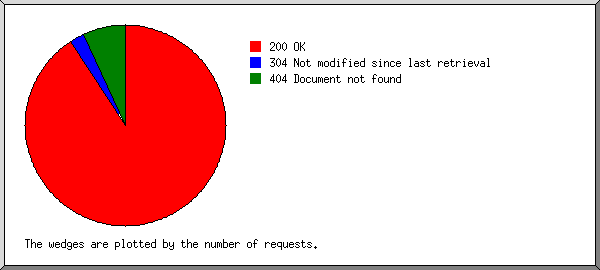
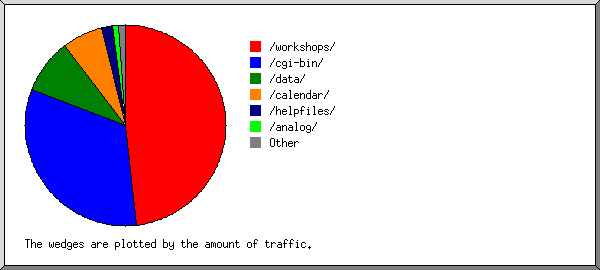
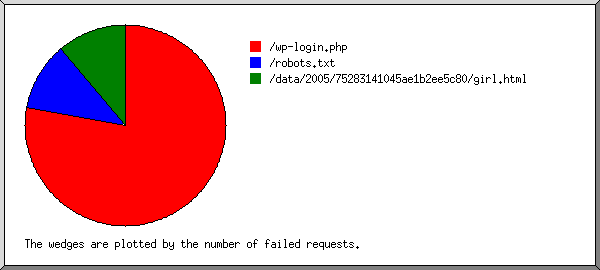
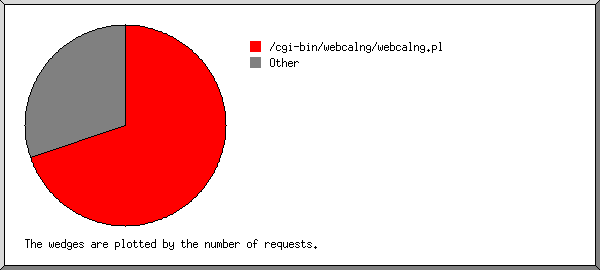
(Go To: Top | General Summary | Monthly Report | Weekly Report | Daily Report | Daily Summary | Hourly Summary | Domain Report | Organization Report | Host Report | Status Code Report | File Size Report | File Type Report | Directory Report | Failure Report | Request Report)
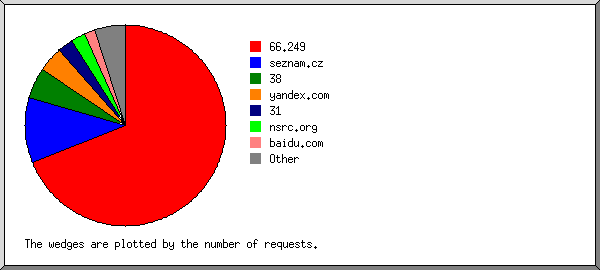
This report lists the computers which requested files.
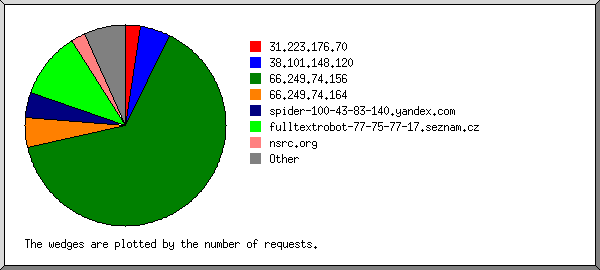
Listing hosts, sorted alphabetically.
| #reqs | %bytes | host |
|---|
| 1 | 3.90% | 111.125.231.188 |
| 14 | 16.81% | host-85-27-8-30.brutele.be |
| 1 | 0.05% | baiduspider-180-76-5-173.crawl.baidu.com |
| 1 | 0.04% | baiduspider-180-76-5-179.crawl.baidu.com |
| 25 | 5.73% | crawl-66-249-73-216.googlebot.com |
| 7 | 1.56% | crawl-66-249-73-65.googlebot.com |
| 2 | 65.93% | msnbot-157-55-16-221.search.msn.com |
| 1 | 0.02% | msnbot-157-55-17-198.search.msn.com |
| 6 | | spider25.picsearch.com |
| 10 | | spider26.picsearch.com |
| 1 | 0.13% | spider-100-43-83-140.yandex.com |
| 1 | 3.90% | s10-13.opera-mini.net |
| 17 | 0.64% | b5131324.yst.yahoo.net |
| 1 | | 195-240-151-127.ip.telfort.nl |
| 2 | 0.71% | swan.lax.dns.icann.org |
| 3 | 0.45% | nsrc.org |
| 1 | 0.03% | 213.186.119.137.utel.net.ua |
| 1 | 0.03% | 213.186.127.28.utel.net.ua |
| 2 | 0.06% | 213.186.122.3.utel.net.ua |
| 1 | 0.03% | 213.186.127.6.utel.net.ua |
 Web Server Statistics for ISOC Workshop Resource Centre
 ) represents 1 request for a page.