(Go To: Top | General Summary | Monthly Report | Weekly Report | Daily Report | Daily Summary | Hourly Summary | Domain Report | Organization Report | Host Report | Search Word Report | Operating System Report | Status Code Report | File Size Report | File Type Report | Directory Report | Failure Report | Request Report)
This report lists the countries of the computers which requested files.

Listing domains, sorted by the amount of traffic.
| #reqs | %bytes | domain |
|---|
| 496 | 31.04% | .com (Commercial) |
| 59 | 29.61% | .np (Nepal) |
| 188 | 16.62% | [unresolved numerical addresses] |
| 3 | 7.20% | .pk (Pakistan) |
| 116 | 5.08% | .net (Networks) |
| 149 | 1.94% | .mx (Mexico) |
| 15 | 1.56% | .ar (Argentina) |
| 2 | 0.97% | .do (Dominican Republic) |
| 15 | 0.82% | .de (Germany) |
| 2 | 0.75% | .fr (France) |
| 54 | 0.73% | .co (Colombia) |
| 24 | 0.67% | .au (Australia) |
| 3 | 0.55% | .il (Israel) |
| 3 | 0.52% | .be (Belgium) |
| 8 | 0.33% | [domain not given] |
| 33 | 0.29% | .br (Brazil) |
| 48 | 0.24% | .pe (Peru) |
| 17 | 0.23% | .ec (Ecuador) |
| 8 | 0.18% | .gr (Greece) |
| 1 | 0.16% | .cl (Chile) |
| 1 | 0.15% | .pl (Poland) |
| 5 | 0.12% | .pt (Portugal) |
| 6 | 0.07% | .in (India) |
| 3 | 0.03% | .org (Non Profit Making Organizations) |
| 4 | 0.03% | .nl (Netherlands) |
| 1 | 0.02% | .ch (Switzerland) |
| 1 | 0.02% | .ci (Ivory Coast) |
| 6 | 0.01% | .se (Sweden) |
| 1 | 0.01% | .tw (Taiwan) |
| 1 | 0.01% | .ca (Canada) |
| 1 | 0.01% | .ee (Estonia) |
| 1 | | .uk (United Kingdom) |
| 1 | | .cz (Czech Republic) |
| 1 | | .ma (Morocco) |
| 288 | | .edu (US Higher Education) |
(Go To: Top | General Summary | Monthly Report | Weekly Report | Daily Report | Daily Summary | Hourly Summary | Domain Report | Organization Report | Host Report | Search Word Report | Operating System Report | Status Code Report | File Size Report | File Type Report | Directory Report | Failure Report | Request Report)
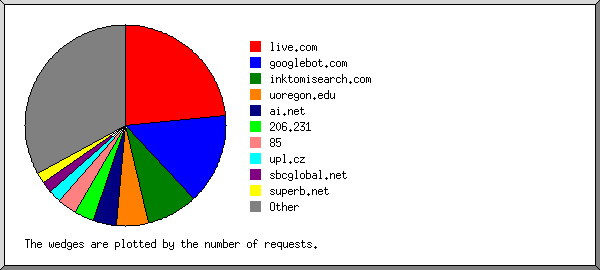
This report lists the computers which requested files.
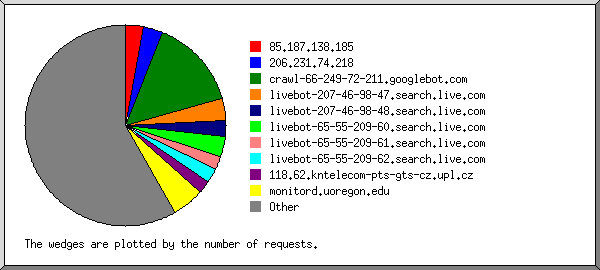
Listing the top 50 hosts by the number of requests, sorted alphabetically.
| #reqs | %bytes | host |
|---|
| 13 | 1.55% | 80.103.176.60 |
| 13 | 1.04% | 200.41.82.98 |
| 12 | 1.23% | 200.72.202.136 |
| 8 | 0.62% | 200.82.221.133 |
| 20 | 3.75% | 200.89.15.21 |
| 21 | 0.14% | 200.121.120.210 |
| 7 | 4.32% | 202.91.72.210 |
| 18 | 0.41% | 203.91.139.238 |
| 12 | 0.03% | 208.53.131.158 |
| 13 | 1.04% | 200-122-97-132.cab.prima.net.ar |
| 14 | | c220-237-88-56.rochd1.qld.optusnet.com.au |
| 6 | 0.01% | 201008083153.user.veloxzone.com.br |
| 5 | 0.04% | 201009079233.user.veloxzone.com.br |
| 49 | 0.19% | conm200-58-214-27.epm.net.co |
| 37 | 4.74% | egspd42469.ask.com |
| 5 | 5.27% | crawl-66-249-64-18.googlebot.com |
| 5 | 0.08% | crawl-66-249-64-33.googlebot.com |
| 8 | 0.03% | crawl-66-249-64-38.googlebot.com |
| 9 | 1.14% | crawl-66-249-64-55.googlebot.com |
| 6 | 0.21% | crawl-66-249-64-58.googlebot.com |
| 8 | 0.21% | crawl-66-249-64-79.googlebot.com |
| 5 | 3.93% | crawl-66-249-71-28.googlebot.com |
| 9 | 0.52% | crawl-66-249-71-32.googlebot.com |
| 9 | 0.22% | crawl-66-249-71-39.googlebot.com |
| 10 | 4.02% | crawl-66-249-71-40.googlebot.com |
| 9 | 0.26% | crawl-66-249-71-67.googlebot.com |
| 5 | 0.05% | crawl-66-249-71-69.googlebot.com |
| 6 | 0.15% | crawl-66-249-71-72.googlebot.com |
| 10 | 0.67% | crawl-66-249-71-73.googlebot.com |
| 27 | 0.12% | sv-crawlfw3.looksmart.com |
| 118 | 0.40% | pc-200-74-124-91.san-damian4.pc.metropolis-inter.com |
| 136 | 1.93% | msnbot.msn.com |
| 13 | 0.74% | ce3.net.hrz.tu-darmstadt.de |
| 17 | 0.23% | cotopaxi.k12.ec |
| 288 | | monitord.uoregon.edu |
| 6 | 0.16% | vdp57212.ath23.cas.hol.gr |
| 6 | 0.07% | delhi-ppp-219.65.251-11.vsnl.net.in |
| 8 | 0.33% | localhost |
| 48 | 0.19% | dsl-201-128-241-123.prod-infinitum.com.mx |
| 40 | 0.07% | dsl-201-138-67-3.prod-infinitum.com.mx |
| 26 | 0.32% | dsl-201-144-67-101.prod-infinitum.com.mx |
| 12 | 0.46% | dup-200-64-54-190.prodigy.net.mx |
| 47 | 0.09% | host-65-173-60-219.acelerate.net |
| 4 | 0.63% | static-200-105-144-220.acelerate.net |
| 11 | 1.28% | c-67-182-234-55.hsd1.ut.comcast.net |
| 4 | | 173.121.101-84.rev.gaoland.net |
| 3 | 0.17% | 80-58-41-42.proxycache.rima-tde.net |
| 59 | 29.61% | grammy.subisu.net.np |
| 47 | 0.09% | client-201.240.143.48.speedy.net.pe |
| 4 | | ua-83-226-77-195.cust.bredbandsbolaget.se |
| 289 | 27.26% | [not listed: 197 hosts] |
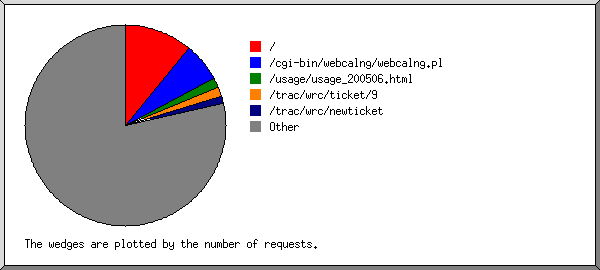
 Web Server Statistics for ISOC Workshop Resource Centre
 ) represents 20 requests for pages or part thereof.