(Go To: Top | General Summary | Monthly Report | Weekly Report | Daily Report | Daily Summary | Hourly Summary | Domain Report | Organization Report | Host Report | Search Word Report | Operating System Report | Status Code Report | File Size Report | File Type Report | Directory Report | Failure Report | Request Report)
This report lists the countries of the computers which requested files.

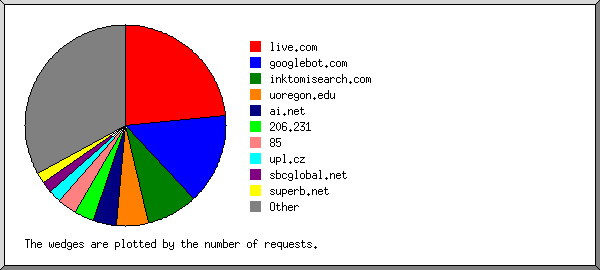
Listing domains, sorted by the amount of traffic.
| #reqs | %bytes | domain |
|---|
| 552 | 50.04% | .com (Commercial) |
| 643 | 24.26% | [unresolved numerical addresses] |
| 223 | 7.61% | .net (Networks) |
| 106 | 3.65% | .mx (Mexico) |
| 76 | 3.03% | .pe (Peru) |
| 41 | 1.44% | .es (Spain) |
| 306 | 1.39% | .edu (US Higher Education) |
| 12 | 1.36% | .fr (France) |
| 73 | 1.07% | .co (Colombia) |
| 41 | 0.95% | .ec (Ecuador) |
| 7 | 0.85% | .ch (Switzerland) |
| 68 | 0.72% | .br (Brazil) |
| 3 | 0.40% | .be (Belgium) |
| 26 | 0.37% | .do (Dominican Republic) |
| 14 | 0.34% | .dk (Denmark) |
| 2 | 0.27% | .se (Sweden) |
| 13 | 0.27% | .uk (United Kingdom) |
| 3 | 0.26% | .pl (Poland) |
| 2 | 0.20% | .ve (Venezuela) |
| 4 | 0.18% | .ar (Argentina) |
| 2 | 0.15% | .fi (Finland) |
| 2 | 0.13% | .nl (Netherlands) |
| 20 | 0.13% | .ca (Canada) |
| 1 | 0.12% | .uy (Uruguay) |
| 5 | 0.11% | .it (Italy) |
| 20 | 0.09% | .by (Belarus) |
| 7 | 0.09% | .in (India) |
| 16 | 0.08% | [unknown domain] |
| 3 | 0.07% | .mil (US Military) |
| 5 | 0.07% | .de (Germany) |
| 4 | 0.06% | .nz (New Zealand) |
| 1 | 0.05% | [domain not given] |
| 13 | 0.05% | .gr (Greece) |
| 4 | 0.04% | .cz (Czech Republic) |
| 2 | 0.02% | .my (Malaysia) |
| 1 | 0.02% | .tr (Turkey) |
| 3 | 0.02% | .pt (Portugal) |
| 4 | 0.02% | .hu (Hungary) |
| 1 | 0.01% | .lt (Lithuania) |
| 1 | 0.01% | .ru (Russia) |
| 2 | 0.01% | .th (Thailand) |
| 1 | | .jp (Japan) |
| 1 | | .kh (Cambodia) |
| 3 | | .ro (Romania) |
(Go To: Top | General Summary | Monthly Report | Weekly Report | Daily Report | Daily Summary | Hourly Summary | Domain Report | Organization Report | Host Report | Search Word Report | Operating System Report | Status Code Report | File Size Report | File Type Report | Directory Report | Failure Report | Request Report)
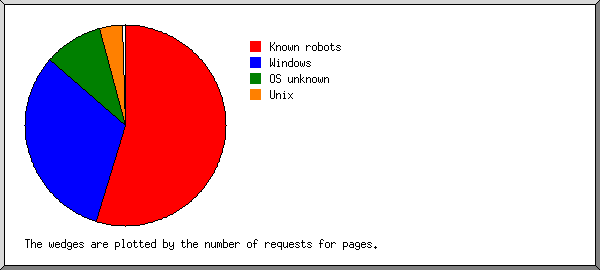
This report lists the computers which requested files.
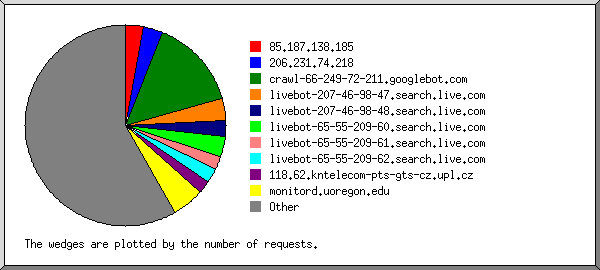
Listing the top 50 hosts by the number of requests, sorted alphabetically.
| #reqs | %bytes | host |
|---|
| 13 | 0.02% | 83.228.36.6 |
| 48 | 0.11% | 150.187.41.93 |
| 161 | 7.83% | 166.114.119.150 |
| 29 | 0.58% | 200.21.20.145 |
| 20 | 1.04% | 200.21.132.68 |
| 12 | 0.01% | 200.41.1.187 |
| 21 | 0.36% | 200.49.173.66 |
| 49 | 0.09% | 200.80.162.254 |
| 48 | 0.11% | 200.106.67.192 |
| 22 | 0.72% | 203.130.205.245 |
| 41 | 0.24% | 210.212.49.11 |
| 13 | 0.07% | 200-207-53-6.speedyterra.com.br |
| 20 | 0.09% | baza.bas-net.by |
| 16 | 0.05% | frankm.storm.ca |
| 48 | 0.11% | catatumbo.ufps.edu.co |
| 17 | 0.42% | extremo_pool_11935-146.etb.net.co |
| 58 | 20.52% | egspd42469.ask.com |
| 13 | 0.10% | crawl-66-249-64-28.googlebot.com |
| 13 | 0.65% | crawl-66-249-64-37.googlebot.com |
| 18 | 1.15% | crawl-66-249-64-38.googlebot.com |
| 16 | 1.61% | crawl-66-249-64-55.googlebot.com |
| 12 | 0.18% | crawl-66-249-64-79.googlebot.com |
| 13 | 0.33% | crawl-66-249-71-18.googlebot.com |
| 17 | 1.02% | crawl-66-249-71-28.googlebot.com |
| 18 | 3.36% | crawl-66-249-71-32.googlebot.com |
| 14 | 5.43% | crawl-66-249-71-40.googlebot.com |
| 17 | 0.66% | crawl-66-249-71-69.googlebot.com |
| 16 | 1.67% | crawl-66-249-71-73.googlebot.com |
| 26 | 0.57% | bi01p1.nc.us.ibm.com |
| 43 | 2.61% | msnbot.msn.com |
| 16 | 0.10% | cr2.turnitin.com |
| 50 | 3.48% | usc7-pool-204.9.204.203.uscolo.com |
| 25 | 0.36% | pri-004-b31.codetel.net.do |
| 20 | 0.32% | as-uio-200-31-8-8.impsat.net.ec |
| 19 | 0.45% | as-uio-64-76-63-105.impsat.net.ec |
| 12 | 0.02% | d60-152.uoregon.edu |
| 288 | | monitord.uoregon.edu |
| 21 | 0.35% | garfio.uned.es |
| 18 | 0.44% | nat2012.usc.es |
| 16 | 0.08% | sasch1031308.phx.gbl |
| 47 | 0.05% | adsl-serv-prosin-6677614229.uninet-ide.com.mx |
| 16 | 1.72% | host-148-244-235-222.block.alestra.net.mx |
| 22 | 0.24% | 217-116-12-91.redes.acens.net |
| 48 | 0.11% | 200-11-197-230.genericrev.cantv.net |
| 19 | 0.47% | 63-109-246-11.reverse.newskies.net |
| 16 | 0.07% | 80-58-6-235.proxycache.rima-tde.net |
| 12 | 0.01% | client-200.106.100.190.speedy.net.pe |
| 17 | 0.74% | client-200.121.32.224.speedy.net.pe |
| 20 | 0.36% | client-201.240.101.239.speedy.net.pe |
| 21 | 0.53% | client-201.240.10.77.speedy.net.pe |
| 742 | 38.41% | [not listed: 361 hosts] |
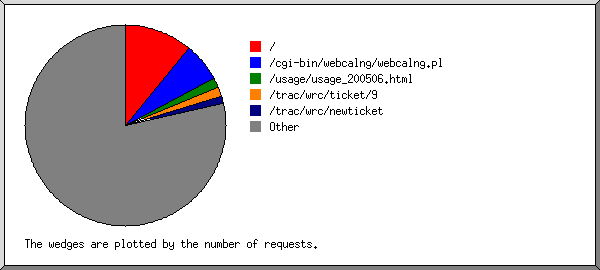
 Web Server Statistics for ISOC Workshop Resource Centre
 ) represents 25 requests for pages or part thereof.