(Go To: Top | General Summary | Monthly Report | Weekly Report | Daily Report | Daily Summary | Hourly Summary | Domain Report | Organization Report | Host Report | Search Word Report | Operating System Report | Status Code Report | File Size Report | File Type Report | Directory Report | Failure Report | Request Report)
This report lists the countries of the computers which requested files.

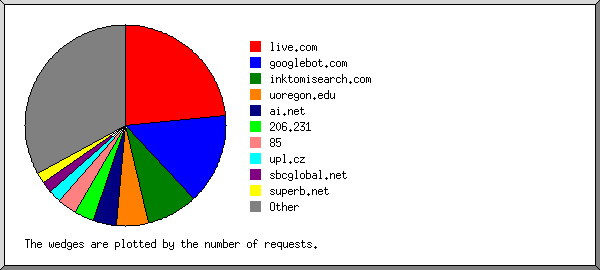
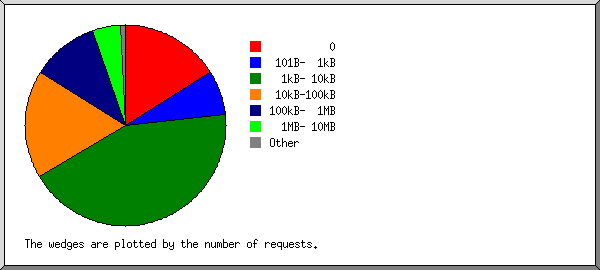
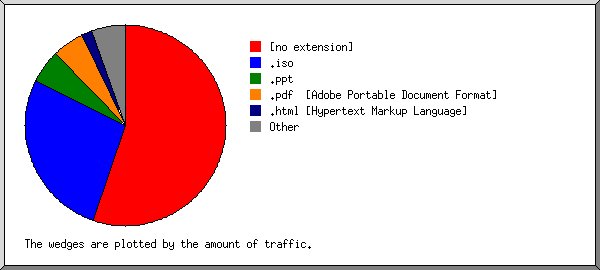
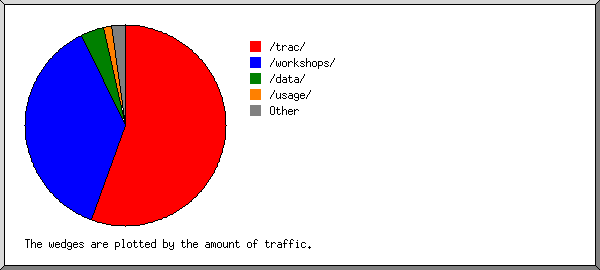
Listing domains, sorted by the amount of traffic.
| #reqs | %bytes | domain |
|---|
| 463 | 32.34% | [unresolved numerical addresses] |
| 161 | 18.72% | .es (Spain) |
| 333 | 16.47% | .com (Commercial) |
| 242 | 11.93% | .net (Networks) |
| 138 | 6.59% | .pe (Peru) |
| 43 | 3.43% | .mx (Mexico) |
| 23 | 2.09% | .de (Germany) |
| 10 | 1.27% | .au (Australia) |
| 11 | 1.14% | .fr (France) |
| 4 | 0.97% | .nl (Netherlands) |
| 5 | 0.95% | .ar (Argentina) |
| 72 | 0.80% | [unknown domain] |
| 3 | 0.48% | .cl (Chile) |
| 78 | 0.39% | .br (Brazil) |
| 298 | 0.34% | .edu (US Higher Education) |
| 5 | 0.31% | .ma (Morocco) |
| 5 | 0.30% | .co (Colombia) |
| 2 | 0.13% | .tr (Turkey) |
| 13 | 0.13% | .my (Malaysia) |
| 1 | 0.12% | [domain not given] |
| 7 | 0.10% | .pt (Portugal) |
| 4 | 0.10% | .it (Italy) |
| 3 | 0.09% | .in (India) |
| 5 | 0.08% | .tw (Taiwan) |
| 1 | 0.08% | .pk (Pakistan) |
| 9 | 0.07% | .uk (United Kingdom) |
| 1 | 0.07% | .kr (South Korea) |
| 3 | 0.07% | .at (Austria) |
| 1 | 0.06% | .vn (Vietnam) |
| 2 | 0.06% | .gov (US Government) |
| 12 | 0.06% | .jp (Japan) |
| 14 | 0.03% | .ec (Ecuador) |
| 3 | 0.03% | .hu (Hungary) |
| 2 | 0.03% | .th (Thailand) |
| 1 | 0.03% | .gr (Greece) |
| 1 | 0.02% | .mz (Mozambique) |
| 5 | 0.02% | .sg (Singapore) |
| 3 | 0.02% | .dk (Denmark) |
| 1 | 0.02% | .ua (Ukraine) |
| 2 | 0.02% | .mil (US Military) |
| 1 | 0.02% | .cz (Czech Republic) |
| 5 | 0.02% | .pl (Poland) |
| 1 | 0.01% | .fi (Finland) |
| 1 | 0.01% | .to (Tonga) |
| 1 | 0.01% | .uy (Uruguay) |
| 1 | 0.01% | .id (Indonesia) |
| 2 | | .ch (Switzerland) |
(Go To: Top | General Summary | Monthly Report | Weekly Report | Daily Report | Daily Summary | Hourly Summary | Domain Report | Organization Report | Host Report | Search Word Report | Operating System Report | Status Code Report | File Size Report | File Type Report | Directory Report | Failure Report | Request Report)
This report lists the computers which requested files.
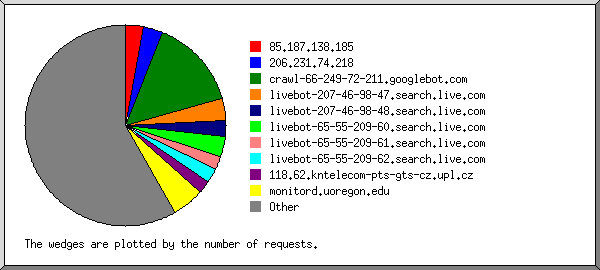
Listing the top 50 hosts by the number of requests, sorted alphabetically.
| #reqs | %bytes | host |
|---|
| 19 | 0.03% | 192.188.59.136 |
| 11 | | 200.41.3.107 |
| 48 | 0.15% | 200.72.159.24 |
| 11 | 0.02% | 200.125.194.62 |
| 6 | 0.01% | 200.199.168.122 |
| 6 | 2.00% | 201.219.0.2 |
| 12 | 0.22% | 202.157.72.250 |
| 30 | 1.33% | 208.29.134.6 |
| 173 | 13.64% | 209.106.169.4 |
| 14 | 0.05% | 209.203.205.90 |
| 9 | 0.98% | 221.237.167.2 |
| 5 | | 13.63.168.202.comindico.com.au |
| 48 | 0.15% | gwmail.ccab.org.br |
| 6 | 3.05% | plms7560-117.pool.007mundo.com |
| 4 | 0.06% | luci62.infonet.com |
| 37 | 0.20% | pc-200-74-124-91.san-damian4.pc.metropolis-inter.com |
| 76 | 8.28% | msnbot.msn.com |
| 37 | 0.06% | cm139038.red.mundo-r.com |
| 18 | 0.03% | ip-216-178-63-40.nw-tel.com |
| 13 | 0.01% | fw12-z-pub-v.dal.sbcidc.com |
| 5 | 1.43% | neptun.spectronic-denmark.com |
| 8 | 0.01% | dial-62-64-221-111.access.uk.tiscali.com |
| 20 | 0.06% | tpiol.tpiol.com |
| 16 | 1.92% | fw-d-whp.denic.de |
| 12 | 0.02% | as-uio-64-76-63-84.impsat.net.ec |
| 288 | | monitord.uoregon.edu |
| 151 | 17.45% | calixto.ls.fi.upm.es |
| 6 | 0.01% | d213-103-217-8.cust.tele2.fr |
| 72 | 0.80% | sasch1031302.phx.gbl |
| 12 | 0.06% | escape.ai.is.saga-u.ac.jp |
| 19 | 1.98% | dsl-200-78-33-184.prod-infinitum.com.mx |
| 7 | 0.41% | inet-gto-aztecas-2-fddi5-0-0.uninet-ide.com.mx |
| 12 | 0.06% | tm.net.my |
| 22 | 0.05% | dsl-084-056-032-117.arcor-ip.net |
| 14 | 1.37% | 37.red-213-227-24.user.auna.net |
| 24 | 0.12% | 200-84-168-55.genericrev.cantv.net |
| 6 | 0.01% | pcp0011004811pcs.longhl01.md.comcast.net |
| 10 | 0.14% | dial002.rdyec.net |
| 6 | 1.62% | 80-58-19-42.proxycache.rima-tde.net |
| 30 | 0.08% | 80-58-33-42.proxycache.rima-tde.net |
| 6 | 0.02% | ctb-cache1-vif1.saix.net |
| 5 | 0.04% | rba-cache2-vif1.saix.net |
| 5 | 0.41% | 221-134-158-141.sify.net |
| 11 | 4.05% | gwmail.gruporpp.com.pe |
| 14 | 0.44% | client-201.240.196.103.speedy.net.pe |
| 7 | 1.07% | client-201.230.43.124.speedy.net.pe |
| 48 | 0.15% | client-201.240.82.236.speedy.net.pe |
| 4 | 0.01% | client-201.240.132.240.speedy.net.pe |
| 48 | 0.15% | client-200.121.239.74.speedy.net.pe |
| 4 | | fw106.internetdsl.tpnet.pl |
| 527 | 35.83% | [not listed: 349 hosts] |
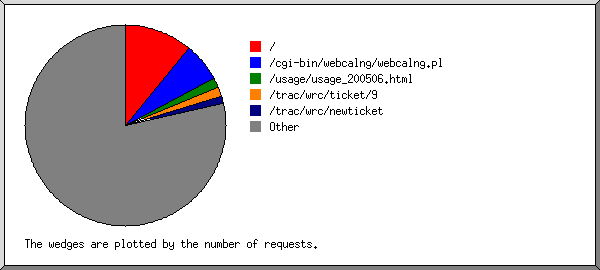
 Web Server Statistics for ISOC Workshop Resource Centre
 ) represents 20 requests for pages or part thereof.