Web Server Statistics for ISOC Workshop Resource Centre

Program started on Sun, Jan 08 2006 at 4:02 AM.
Analyzed requests from Sat, Jan 07 2006 at 4:03 AM to Sun, Jan 08 2006 at 4:04 AM (1.00 days).

General Summary

(Go To: Top | General Summary | Daily Report | Daily Summary | Hourly Summary | Domain Report | Organization Report | Host Report | Search Word Report | Operating System Report | Status Code Report | File Size Report | File Type Report | Directory Report | Failure Report | Request Report)

This report contains overall statistics.

Successful requests: 3,287
Average successful requests per day: 3,283
Successful requests for pages: 1,821
Average successful requests for pages per day: 1,818
Failed requests: 227
Redirected requests: 40
Distinct files requested: 1,822
Distinct hosts served: 475
Corrupt logfile lines: 491
Unwanted logfile entries: 28,496
Data transferred: 384.51 megabytes
Average data transferred per day: 384.24 megabytes

Daily Report

(Go To: Top | General Summary | Daily Report | Daily Summary | Hourly Summary | Domain Report | Organization Report | Host Report | Search Word Report | Operating System Report | Status Code Report | File Size Report | File Type Report | Directory Report | Failure Report | Request Report)

This report lists the activity in each day.

Each unit (+) represents 40 requests for pages or part thereof.

date#reqs#pages 
Jan/ 7/0626241413++++++++++++++++++++++++++++++++++++
    
Jan/ 8/06663408+++++++++++

Busiest day: Jan/ 7/06 (1,413 requests for pages).

Daily Summary

(Go To: Top | General Summary | Daily Report | Daily Summary | Hourly Summary | Domain Report | Organization Report | Host Report | Search Word Report | Operating System Report | Status Code Report | File Size Report | File Type Report | Directory Report | Failure Report | Request Report)

This report lists the total activity for each day of the week, summed over all the weeks in the report.

Each unit (+) represents 40 requests for pages or part thereof.

day#reqs#pages 
Sun663408+++++++++++
Mon00
Tue00
Wed00
Thu00
Fri00
Sat26241413++++++++++++++++++++++++++++++++++++

Hourly Summary

(Go To: Top | General Summary | Daily Report | Daily Summary | Hourly Summary | Domain Report | Organization Report | Host Report | Search Word Report | Operating System Report | Status Code Report | File Size Report | File Type Report | Directory Report | Failure Report | Request Report)

This report lists the total activity for each hour of the day, summed over all the days in the report.

Each unit (+) represents 5 requests for pages or part thereof.

hour#reqs#pages 
03922+++++
1316191+++++++++++++++++++++++++++++++++++++++
213499++++++++++++++++++++
311941+++++++++
4189134+++++++++++++++++++++++++++
519891+++++++++++++++++++
610552+++++++++++
7226144+++++++++++++++++++++++++++++
816268++++++++++++++
917842+++++++++
1014775+++++++++++++++
116338++++++++
128835+++++++
136544+++++++++
1426387++++++++++++++++++
1512987++++++++++++++++++
1611693+++++++++++++++++++
178864+++++++++++++
1811355+++++++++++
198528++++++
206555+++++++++++
2110535+++++++
22128103+++++++++++++++++++++
23166138++++++++++++++++++++++++++++

Domain Report

(Go To: Top | General Summary | Daily Report | Daily Summary | Hourly Summary | Domain Report | Organization Report | Host Report | Search Word Report | Operating System Report | Status Code Report | File Size Report | File Type Report | Directory Report | Failure Report | Request Report)

This report lists the countries of the computers which requested files.

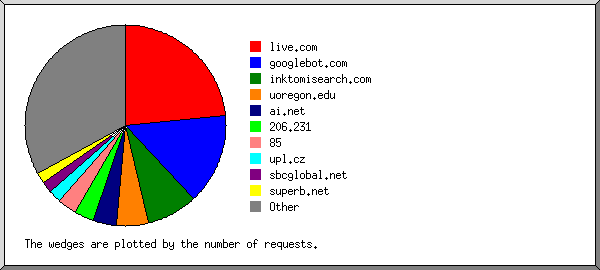
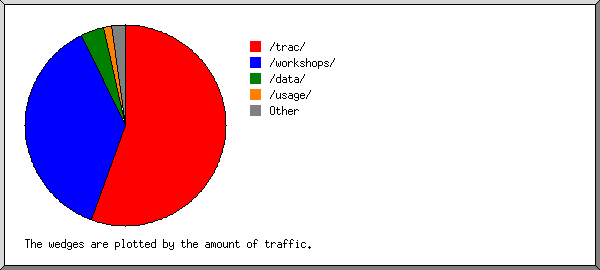
Listing domains, sorted by the amount of traffic.

#reqs%bytesdomain
179677.16%.com (Commercial)
270 8.95%[unresolved numerical addresses]
280 4.31%.net (Networks)
218 3.65%.fr (France)
85 1.64%.mx (Mexico)
139 0.91%.at (Austria)
23 0.86%.pe (Peru)
10 0.43%.es (Spain)
4 0.26%.it (Italy)
2 0.22%.pk (Pakistan)
3 0.22%.in (India)
2 0.20%.ru (Russia)
4 0.17%.pl (Poland)
29 0.11%.br (Brazil)
2 0.10%.do (Dominican Republic)
2 0.08%.cl (Chile)
22 0.07%.ca (Canada)
3 0.06%.ar (Argentina)
8 0.06%.ch (Switzerland)
7 0.05%.uk (United Kingdom)
1 0.05%.co (Colombia)
1 0.05%[domain not given]
7 0.05%.sg (Singapore)
7 0.04%.th (Thailand)
2 0.03%.bo (Bolivia)
3 0.03%.fi (Finland)
1 0.03%.arpa (Arpanet)
18 0.03%.jp (Japan)
5 0.03%.de (Germany)
1 0.02%.cz (Czech Republic)
6 0.02%.ir (Iran)
3 0.02%.au (Australia)
2 0.01%.pt (Portugal)
292 0.01%.edu (US Higher Education)
1 0.01%.my (Malaysia)
4 0.01%.se (Sweden)
5 0.01%.nl (Netherlands)
2 0.01%[unknown domain]
1 0.01%.jo (Jordan)
1 .hu (Hungary)
2 .sk (Slovakia)
1 .ma (Morocco)
1 .org (Non Profit Making Organizations)
1 .bg (Bulgaria)
10 .mil (US Military)

Organization Report

(Go To: Top | General Summary | Daily Report | Daily Summary | Hourly Summary | Domain Report | Organization Report | Host Report | Search Word Report | Operating System Report | Status Code Report | File Size Report | File Type Report | Directory Report | Failure Report | Request Report)

This report lists the organizations of the computers which requested files.

Listing the top 20 organizations by the number of requests, sorted by the number of requests.

#reqs%bytesorganization
93740.21%msn.com
514 2.62%googlebot.com
288 uoregon.edu
212 3.34%wanadoo.fr
138 0.91%vie.surfer.at
13331.93%tpiol.com
76 1.10%inktomisearch.com
70 1.48%prod-infinitum.com.mx
47 0.03%61.254
46 0.34%comcast.net
41 0.38%213.188
38 0.95%rima-tde.net
34 0.27%cox.net
24 0.45%dir.com
23 0.86%speedy.net.pe
23 0.08%looksmart.com
23 0.05%81.193
21 0.16%rr.com
20 0.19%proxad.net
20 0.02%sympatico.ca
55914.62%[not listed: 206 organizations]

Host Report

(Go To: Top | General Summary | Daily Report | Daily Summary | Hourly Summary | Domain Report | Organization Report | Host Report | Search Word Report | Operating System Report | Status Code Report | File Size Report | File Type Report | Directory Report | Failure Report | Request Report)

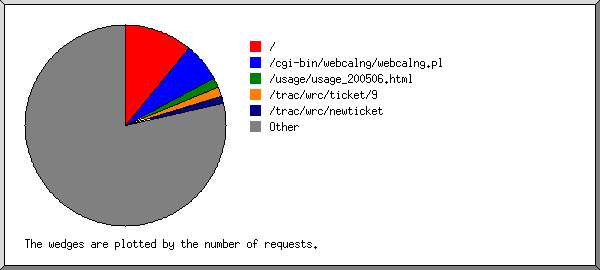
This report lists the computers which requested files.

Listing the top 50 hosts by the number of requests, sorted alphabetically.

#reqs%byteshost
47 0.03%61.254.203.74
8 0.04%69.79.98.124
23 0.05%81.193.13.193
8 0.48%193.194.69.82
41 0.38%213.188.200.251
138 0.91%chello084112018113.27.11.vie.surfer.at
18 0.02%toronto-hse-ppp4284028.sympatico.ca
13 0.02%acbb0df0.ipt.aol.com
24 0.45%crawl26.dir.com
15 0.07%crawl-66-249-64-16.googlebot.com
8 0.22%crawl-66-249-64-28.googlebot.com
10 crawl-66-249-64-37.googlebot.com
10 0.05%crawl-66-249-64-38.googlebot.com
15 0.08%crawl-66-249-64-4.googlebot.com
13 0.01%crawl-66-249-64-42.googlebot.com
10 0.05%crawl-66-249-64-58.googlebot.com
178 1.20%crawl-66-249-66-244.googlebot.com
8 0.05%crawl-66-249-71-28.googlebot.com
11 0.01%crawl-66-249-71-33.googlebot.com
8 crawl-66-249-71-39.googlebot.com
11 0.01%crawl-66-249-71-41.googlebot.com
12 0.01%crawl-66-249-71-44.googlebot.com
9 0.01%crawl-66-249-71-54.googlebot.com
13 0.02%crawl-66-249-71-69.googlebot.com
9 0.01%crawl-66-249-71-72.googlebot.com
15 0.15%crawl-66-249-71-73.googlebot.com
10 0.22%crawl-66-249-71-78.googlebot.com
22 0.05%sv-crawlfw3.looksmart.com
92940.17%msnbot.msn.com
8 0.04%msnbot64042.search.msn.com
11 rrcs-24-153-161-178.sw.biz.rr.com
13331.93%tpiol.tpiol.com
288 monitord.uoregon.edu
8 0.23%85-60-128-238.bil2.adsl.uni2.es
199 2.72%anantes-154-1-62-14.w81-53.abo.wanadoo.fr
15 z210.61-45-47.ppp.wakwak.ne.jp
10 centaf-n.noscd.centaf.af.mil
48 0.06%dsl-201-138-85-12.prod-infinitum.com.mx
7 0.14%153-37.reduno.com.mx
15 0.03%85-64-99-101.barak-online.net
17 0.04%200-93-117-237.genericrev.cantv.net
21 0.02%c-67-165-191-91.hsd1.il.comcast.net
11 0.01%pcp0011492819pcs.eatntn01.nj.comcast.net
27 0.01%ip68-6-139-4.sd.sd.cox.net
10 0.05%cdif-cache-6.server.ntli.net
12 0.03%adsl-69-225-194-25.dsl.scrm01.pacbell.net
13 0.03%lns-bzn-51f-81-56-133-140.adsl.proxad.net
22 0.02%77.red-83-49-104.dynamicip.rima-tde.net
8 0.46%196.red-81-40-134.staticip.rima-tde.net
10 0.46%client-200.121.145.252.speedy.net.pe
75818.93%[not listed: 425 hosts]

Search Word Report

(Go To: Top | General Summary | Daily Report | Daily Summary | Hourly Summary | Domain Report | Organization Report | Host Report | Search Word Report | Operating System Report | Status Code Report | File Size Report | File Type Report | Directory Report | Failure Report | Request Report)

This report lists which words people used in search engines to find the site.

Listing the top 30 query words by the number of requests, sorted by the number of requests.

#reqssearch term
25freebsd
17cisco
13ppt
12ip
11to
11ping.c
10windows
10pdf
10freaks
10astral
9exim
8in
8router
8pessoal
8dns
7fedora
7vs
7defesa
7config
7de
6apache
6xp
6ospf
6how
6configuration
6subnetting
5gcc
5make
5example
5linux
633[not listed: 438 search terms]

Operating System Report

(Go To: Top | General Summary | Daily Report | Daily Summary | Hourly Summary | Domain Report | Organization Report | Host Report | Search Word Report | Operating System Report | Status Code Report | File Size Report | File Type Report | Directory Report | Failure Report | Request Report)

This report lists the operating systems used by visitors.

Listing operating systems, sorted by the number of requests for pages.

##reqs#pagesOS
114881096Known robots
21140265Windows
 993231  Windows XP
 8715  Windows 2000
 309  Windows 98
 204  Windows Server 2003
 53  Windows NT
 42  Windows 95
 11  Windows ME
3309140OS unknown
45025Unix
 4018  Linux
 107  BSD
543Macintosh
611Amiga

Status Code Report

(Go To: Top | General Summary | Daily Report | Daily Summary | Hourly Summary | Domain Report | Organization Report | Host Report | Search Word Report | Operating System Report | Status Code Report | File Size Report | File Type Report | Directory Report | Failure Report | Request Report)

This report lists the HTTP status codes of all requests.

Listing status codes, sorted numerically.

#reqsstatus code
2966200 OK
113206 Partial content
27301 Document moved permanently
13302 Document found elsewhere
208304 Not modified since last retrieval
222404 Document not found
1405 Method not allowed
4406 Document not acceptable to client

File Size Report

(Go To: Top | General Summary | Daily Report | Daily Summary | Hourly Summary | Domain Report | Organization Report | Host Report | Search Word Report | Operating System Report | Status Code Report | File Size Report | File Type Report | Directory Report | Failure Report | Request Report)

This report lists the sizes of files.

size#reqs%bytes
0534 
1B- 10B0 
11B- 100B11 
101B- 1kB314 0.04%
1kB- 10kB1545 1.53%
10kB-100kB574 4.24%
100kB- 1MB27019.30%
1MB- 10MB3623.48%
10MB-100MB222.11%
100MB- 1GB129.30%

File Type Report

(Go To: Top | General Summary | Daily Report | Daily Summary | Hourly Summary | Domain Report | Organization Report | Host Report | Search Word Report | Operating System Report | Status Code Report | File Size Report | File Type Report | Directory Report | Failure Report | Request Report)

This report lists the extensions of files.

Listing extensions with at least 0.1% of the traffic, sorted by the amount of traffic.

#reqs%bytesextension
247.27%.iso
22918.68%.pdf [Adobe Portable Document Format]
17 9.11%.zip [Zip archives]
127 6.33%.ppt
54 5.41%.gz [Gzip compressed files]
13 4.79%  .tar.gz [Compressed archives]
40 0.51%  .ps.gz [Gzipped PostScript]
3 3.11%.ps [PostScript]
76 2.10%.sxi
64 1.61%.jpeg [JPEG graphics]
893 1.36%.html [Hypertext Markup Language]
2 1.13%.ZIP
122 1.11%.pl [Perl scripts]
834 0.70%[directories]
160 0.51%.php [PHP]
1 0.39%.graffle
131 0.27%.jpg [JPEG graphics]
27 0.20%.txt [Plain text]
2 0.18%.dmg
2 0.15%.PDF
339 0.11%.gif [GIF graphics]
202 0.26%[not listed: 13 extensions]

Directory Report

(Go To: Top | General Summary | Daily Report | Daily Summary | Hourly Summary | Domain Report | Organization Report | Host Report | Search Word Report | Operating System Report | Status Code Report | File Size Report | File Type Report | Directory Report | Failure Report | Request Report)

This report lists the directories from which files were requested. (The figures for each directory include all of its subdirectories.)

Listing directories with at least 0.01% of the traffic, sorted by the amount of traffic.

#reqs%bytesdirectory
173373.15%/workshops/
18024.03%/data/
126 1.11%/cgi-bin/
495 0.86%/archive/
29 0.18%/materials/
14 0.15%/calendar/
322 0.15%[root directory]
93 0.14%/helpfiles/
30 0.08%/planning/
18 0.05%/search/
10 0.03%/organizers/
9 0.02%/mailing/
4 0.01%/peer-review/
5 0.01%/instructors/
219 0.03%[not listed: 4 directories]

Failure Report

(Go To: Top | General Summary | Daily Report | Daily Summary | Hourly Summary | Domain Report | Organization Report | Host Report | Search Word Report | Operating System Report | Status Code Report | File Size Report | File Type Report | Directory Report | Failure Report | Request Report)

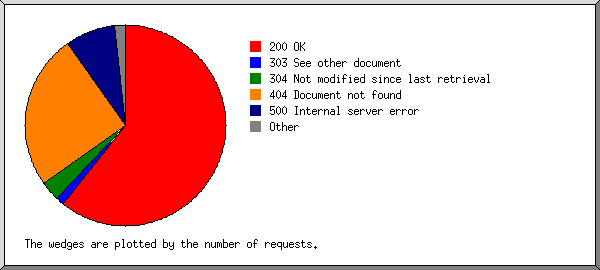
This report lists the files that caused failures, for example files not found.

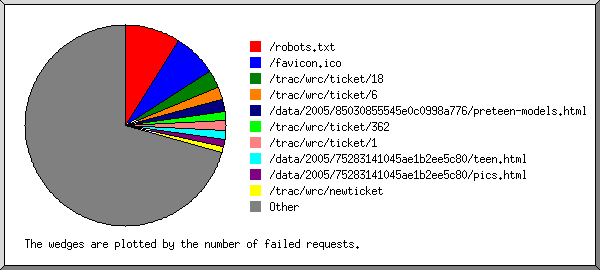
Listing files, sorted by the number of failed requests.

#reqsfile
121/favicon.ico
59/robots.txt
7/planning/images/singlepix.gif
5/images/singlepix.gif
4/_vti_bin/shtml.exe/_vti_rpc
4/_vti_inf.html
3/helpfiles/www.pacnog.org
2/archive/organizers/madea.htm
2/workshops/2005/ccTLD-Nairobi/http
2/organizers/images/singlepix.gif
1/cobalt-images/welcome2.gif
1/archive/organizers/loft.htm
1/archive/Ej-1.htm
1http://umsky.com/prx.php
1/calendar/images/singlepix.gif
1/archive/organizers/hostales.htm
1/workshops/2004/ccTLD-Amsterdam/photos/
1/archive/organizers/pareadas.htm
1/archive/organizers/constructores.htm
1/helpfiles/www.apnic.net
1/workshops/2004/ccTLD-Amsterdam/day1/freebsd/freebsdref-1up.pdf
1/workshops/2005/ccTLD-Dakar/jour1/freebsd/WhyFreeBSD.htm
1/workshops/2005/cctld-nairobi/day1/freebsd/intro-freebsd-install.html
1/workshops/2004/sanog-iv/ip-services/presentations/courier-imap/tuning.htm
1/data/2003/145088522400b83f9b7630/ciscointro.ppt
1/helpfiles/www.apricot.net
1/workshops/2004/CEDIA2/material/Introduccion_a_redes.pdf
1/workshops/2005/SANOG-VI/ip-services/routing/

Request Report

(Go To: Top | General Summary | Daily Report | Daily Summary | Hourly Summary | Domain Report | Organization Report | Host Report | Search Word Report | Operating System Report | Status Code Report | File Size Report | File Type Report | Directory Report | Failure Report | Request Report)

This report lists the files on the site.

Listing files with at least 20 requests, sorted by the number of requests.

#reqs%byteslast timefile
318 0.13%Jan/ 8/06 4:01 AM/
121 1.10%Jan/ 8/06 3:25 AM/cgi-bin/webcalng/webcalng.pl
83 0.14%Jan/ 8/06 1:43 AM/helpfiles/workshop_info_main.php
46 0.19%Jan/ 8/06 3:10 AM/archive/organizers/
32 Jan/ 8/06 3:32 AM/icons/blank.gif
31 Jan/ 8/06 3:32 AM/icons/back.gif
21 Jan/ 8/06 3:32 AM/icons/folder.gif
263598.43%Jan/ 8/06 4:04 AM[not listed: 1,517 files]