Web Server Statistics for ISOC Workshop Resource Centre

Program started on Sun, Jul 01 2012 at 5:30 AM.
Analyzed requests from Sun, Jul 01 2012 at 4:57 AM to Sun, Jul 01 2012 at 5:30 AM (0.02 days).

General Summary

(Go To: Top | General Summary | Monthly Report | Weekly Report | Daily Report | Daily Summary | Hourly Summary | Domain Report | Organization Report | Host Report | Status Code Report | File Size Report | File Type Report | Directory Report | Failure Report | Request Report)

This report contains overall statistics.

Successful requests: 192
Average successful requests per day: 8,334
Successful requests for pages: 12
Average successful requests for pages per day: 480
Failed requests: 4
Redirected requests: 1
Distinct files requested: 179
Distinct hosts served: 22
Data transferred: 15.25 megabytes
Average data transferred per day: 665.45 megabytes

Monthly Report

(Go To: Top | General Summary | Monthly Report | Weekly Report | Daily Report | Daily Summary | Hourly Summary | Domain Report | Organization Report | Host Report | Status Code Report | File Size Report | File Type Report | Directory Report | Failure Report | Request Report)

This report lists the activity in each month.

Each unit (+) represents 1 request for a page.

month#reqs#pages 
Jul 201219212++++++++++++

Busiest month: Jul 2012 (12 requests for pages).

Weekly Report

(Go To: Top | General Summary | Monthly Report | Weekly Report | Daily Report | Daily Summary | Hourly Summary | Domain Report | Organization Report | Host Report | Status Code Report | File Size Report | File Type Report | Directory Report | Failure Report | Request Report)

This report lists the activity in each week.

Each unit (+) represents 1 request for a page.

week beg.#reqs#pages 
Jul/ 1/1219212++++++++++++

Busiest week: week beginning Jul/ 1/12 (12 requests for pages).

Daily Report

(Go To: Top | General Summary | Monthly Report | Weekly Report | Daily Report | Daily Summary | Hourly Summary | Domain Report | Organization Report | Host Report | Status Code Report | File Size Report | File Type Report | Directory Report | Failure Report | Request Report)

This report lists the activity in each day.

Each unit (+) represents 1 request for a page.

date#reqs#pages 
Jul/ 1/1219212++++++++++++

Busiest day: Jul/ 1/12 (12 requests for pages).

Daily Summary

(Go To: Top | General Summary | Monthly Report | Weekly Report | Daily Report | Daily Summary | Hourly Summary | Domain Report | Organization Report | Host Report | Status Code Report | File Size Report | File Type Report | Directory Report | Failure Report | Request Report)

This report lists the total activity for each day of the week, summed over all the weeks in the report.

Each unit (+) represents 1 request for a page.

day#reqs#pages 
Sun19212++++++++++++
Mon00
Tue00
Wed00
Thu00
Fri00
Sat00

Hourly Summary

(Go To: Top | General Summary | Monthly Report | Weekly Report | Daily Report | Daily Summary | Hourly Summary | Domain Report | Organization Report | Host Report | Status Code Report | File Size Report | File Type Report | Directory Report | Failure Report | Request Report)

This report lists the total activity for each hour of the day, summed over all the days in the report.

Each unit (+) represents 1 request for a page.

hour#reqs#pages 
000
100
200
300
4161+
517611+++++++++++
600
700
800
900
1000
1100
1200
1300
1400
1500
1600
1700
1800
1900
2000
2100
2200
2300

Domain Report

(Go To: Top | General Summary | Monthly Report | Weekly Report | Daily Report | Daily Summary | Hourly Summary | Domain Report | Organization Report | Host Report | Status Code Report | File Size Report | File Type Report | Directory Report | Failure Report | Request Report)

This report lists the countries of the computers which requested files.

Listing domains, sorted by the amount of traffic.

#reqs%bytesdomain
17026.57%.com (Commercial)
120.93%.ae (United Arab Emirates)
120.31%.se (Sweden)
120.31%.de (Germany)
510.33%.net (Networks)
8 0.61%.org (Non Profit Making Organizations)
2 0.53%.nl (Netherlands)
2 0.28%.br (Brazil)
2 0.13%[unresolved numerical addresses]

Organization Report

(Go To: Top | General Summary | Monthly Report | Weekly Report | Daily Report | Daily Summary | Hourly Summary | Domain Report | Organization Report | Host Report | Status Code Report | File Size Report | File Type Report | Directory Report | Failure Report | Request Report)

This report lists the organizations of the computers which requested files.

Listing organizations, sorted by the number of requests.

#reqs%bytesorganization
16221.25%googlebot.com
7 0.45%nsrc.org
4 0.75%baidu.com
3 0.99%beamtele.net
3 4.56%msn.com
2 0.28%telesp.net.br
2 9.35%cox.net
120.31%ccc.de
120.31%ipredator.se
1 iforcenetworks.com
120.93%alshamil.net.ae
1 0.16%telfort.nl
1 0.06%119
1 0.06%94
1 0.16%icann.org
1 0.37%chello.nl

Host Report

(Go To: Top | General Summary | Monthly Report | Weekly Report | Daily Report | Daily Summary | Hourly Summary | Domain Report | Organization Report | Host Report | Status Code Report | File Size Report | File Type Report | Directory Report | Failure Report | Request Report)

This report lists the computers which requested files.

Listing hosts, sorted alphabetically.

#reqs%byteshost
1 0.06%94.228.34.207
1 0.06%119.63.196.40
120.93%bba59120.alshamil.net.ae
2 0.28%200-232-193-239.dsl.telesp.net.br
1 baiduspider-123-125-71-31.crawl.baidu.com
1 0.70%baiduspider-123-125-71-60.crawl.baidu.com
1 0.02%baiduspider-180-76-5-139.crawl.baidu.com
1 0.02%baiduspider-180-76-5-89.crawl.baidu.com
30 3.06%crawl-66-249-71-211.googlebot.com
13218.20%crawl-66-249-71-26.googlebot.com
1 shiny.iforcenetworks.com
1 0.13%msnbot-157-55-16-229.search.msn.com
1 0.06%msnbot-207-46-13-115.search.msn.com
1 4.38%msnbot-207-46-199-53.search.msn.com
120.31%tor20.anonymizer.ccc.de
3 0.99%ras.beamtele.net
2 9.35%ip68-227-117-40.ok.ok.cox.net
1 0.37%d110226.upc-d.chello.nl
1 0.16%195-240-151-127.ip.telfort.nl
1 0.16%swan.lax.dns.icann.org
7 0.45%nsrc.org
120.31%exit3.ipredator.se

Status Code Report

(Go To: Top | General Summary | Monthly Report | Weekly Report | Daily Report | Daily Summary | Hourly Summary | Domain Report | Organization Report | Host Report | Status Code Report | File Size Report | File Type Report | Directory Report | Failure Report | Request Report)

This report lists the HTTP status codes of all requests.

Listing status codes, sorted numerically.

#reqsstatus code
187200 OK
2206 Partial content
1301 Document moved permanently
3304 Not modified since last retrieval
4404 Document not found

File Size Report

(Go To: Top | General Summary | Monthly Report | Weekly Report | Daily Report | Daily Summary | Hourly Summary | Domain Report | Organization Report | Host Report | Status Code Report | File Size Report | File Type Report | Directory Report | Failure Report | Request Report)

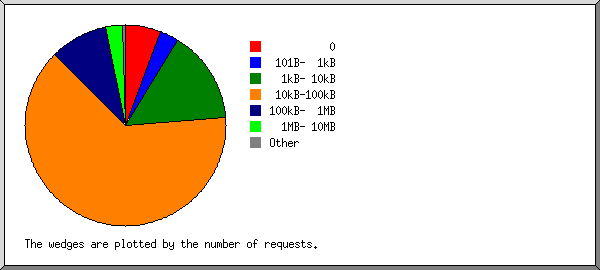
This report lists the sizes of files.

size#reqs%bytes
06 
1B- 10B0 
11B- 100B0 
101B- 1kB1 
1kB- 10kB15 0.43%
10kB-100kB16221.07%
100kB- 1MB4 7.60%
1MB- 10MB470.90%

File Type Report

(Go To: Top | General Summary | Monthly Report | Weekly Report | Daily Report | Daily Summary | Hourly Summary | Domain Report | Organization Report | Host Report | Status Code Report | File Size Report | File Type Report | Directory Report | Failure Report | Request Report)

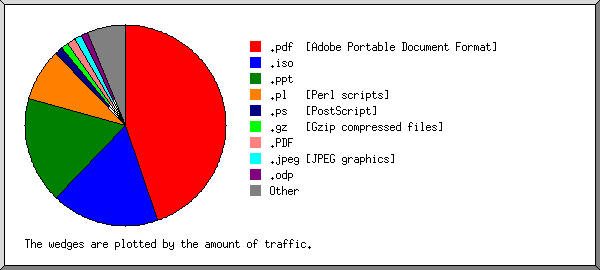
This report lists the extensions of files.

Listing extensions with at least 0.1% of the traffic, sorted by the amount of traffic.

#reqs%bytesextension
1456.40%.pdf [Adobe Portable Document Format]
421.64%.ppt
15519.04%.pl [Perl scripts]
1 1.61%.jpeg [JPEG graphics]
10 0.78%[directories]
2 0.31%.ics
6 0.21%[not listed: 4 extensions]

Directory Report

(Go To: Top | General Summary | Monthly Report | Weekly Report | Daily Report | Daily Summary | Hourly Summary | Domain Report | Organization Report | Host Report | Status Code Report | File Size Report | File Type Report | Directory Report | Failure Report | Request Report)

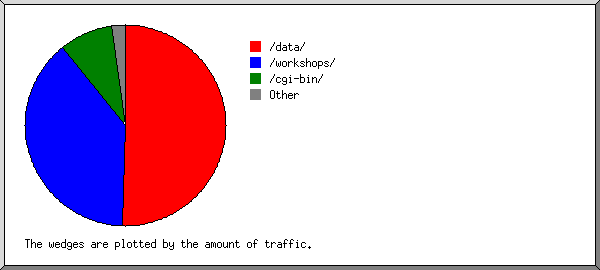
This report lists the directories from which files were requested. (The figures for each directory include all of its subdirectories.)

Listing directories with at least 0.01% of the traffic, sorted by the amount of traffic.

#reqs%bytesdirectory
1376.10%/data/
15519.04%/cgi-bin/
12 3.90%/workshops/
9 0.58%[root directory]
2 0.31%/calendar/
1 0.06%/helpfiles/

Failure Report

(Go To: Top | General Summary | Monthly Report | Weekly Report | Daily Report | Daily Summary | Hourly Summary | Domain Report | Organization Report | Host Report | Status Code Report | File Size Report | File Type Report | Directory Report | Failure Report | Request Report)

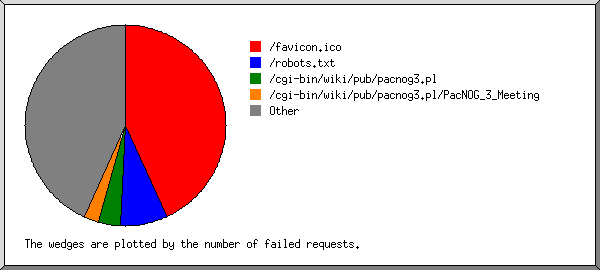
This report lists the files that caused failures, for example files not found.

Listing files, sorted by the number of failed requests.

#reqsfile
2/robots.txt
2/favicon.ico

Request Report

(Go To: Top | General Summary | Monthly Report | Weekly Report | Daily Report | Daily Summary | Hourly Summary | Domain Report | Organization Report | Host Report | Status Code Report | File Size Report | File Type Report | Directory Report | Failure Report | Request Report)

This report lists the files on the site.

Listing files with at least 20 requests, sorted by the number of requests.

#reqs%byteslast timefile
15519.04%Jul/ 1/12 5:30 AM/cgi-bin/webcalng/webcalng.pl
3780.96%Jul/ 1/12 5:28 AM[not listed: 23 files]