Program started on Sun, Dec 25 2005 at 4:23 AM.
Analyzed requests from Sun, Dec 25 2005 at 4:07 AM to Sun, Dec 25 2005 at 4:23 AM (0.01 days).
(Go To: Top | General Summary | Monthly Report | Weekly Report | Daily Report | Daily Summary | Hourly Summary | Domain Report | Organization Report | Host Report | Status Code Report | File Size Report | File Type Report | Directory Report | Failure Report | Request Report)
This report contains overall statistics.
Successful requests: 41
Successful requests for pages: 21
Failed requests: 3
Redirected requests: 3
Distinct files requested: 36
Distinct hosts served: 22
Data transferred: 677.93 kilobytes
(Go To: Top | General Summary | Monthly Report | Weekly Report | Daily Report | Daily Summary | Hourly Summary | Domain Report | Organization Report | Host Report | Status Code Report | File Size Report | File Type Report | Directory Report | Failure Report | Request Report)
This report lists the activity in each month.
Each unit () represents 1 request for a page.
month | #reqs | #pages | |
---|---|---|---|
Dec 2005 | 41 | 21 |
Busiest month: Dec 2005 (21 requests for pages).
(Go To: Top | General Summary | Monthly Report | Weekly Report | Daily Report | Daily Summary | Hourly Summary | Domain Report | Organization Report | Host Report | Status Code Report | File Size Report | File Type Report | Directory Report | Failure Report | Request Report)
This report lists the activity in each week.
Each unit () represents 1 request for a page.
week beg. | #reqs | #pages | |
---|---|---|---|
Dec/25/05 | 41 | 21 |
Busiest week: week beginning Dec/25/05 (21 requests for pages).
(Go To: Top | General Summary | Monthly Report | Weekly Report | Daily Report | Daily Summary | Hourly Summary | Domain Report | Organization Report | Host Report | Status Code Report | File Size Report | File Type Report | Directory Report | Failure Report | Request Report)
This report lists the activity in each day.
Each unit () represents 1 request for a page.
date | #reqs | #pages | |
---|---|---|---|
Dec/25/05 | 41 | 21 |
Busiest day: Dec/25/05 (21 requests for pages).
(Go To: Top | General Summary | Monthly Report | Weekly Report | Daily Report | Daily Summary | Hourly Summary | Domain Report | Organization Report | Host Report | Status Code Report | File Size Report | File Type Report | Directory Report | Failure Report | Request Report)
This report lists the total activity for each day of the week, summed over all the weeks in the report.
Each unit () represents 1 request for a page.
day | #reqs | #pages | |
---|---|---|---|
Sun | 41 | 21 | |
Mon | 0 | 0 | |
Tue | 0 | 0 | |
Wed | 0 | 0 | |
Thu | 0 | 0 | |
Fri | 0 | 0 | |
Sat | 0 | 0 |
(Go To: Top | General Summary | Monthly Report | Weekly Report | Daily Report | Daily Summary | Hourly Summary | Domain Report | Organization Report | Host Report | Status Code Report | File Size Report | File Type Report | Directory Report | Failure Report | Request Report)
This report lists the total activity for each hour of the day, summed over all the days in the report.
Each unit () represents 1 request for a page.
hour | #reqs | #pages | |
---|---|---|---|
0 | 0 | 0 | |
1 | 0 | 0 | |
2 | 0 | 0 | |
3 | 0 | 0 | |
4 | 41 | 21 | |
5 | 0 | 0 | |
6 | 0 | 0 | |
7 | 0 | 0 | |
8 | 0 | 0 | |
9 | 0 | 0 | |
10 | 0 | 0 | |
11 | 0 | 0 | |
12 | 0 | 0 | |
13 | 0 | 0 | |
14 | 0 | 0 | |
15 | 0 | 0 | |
16 | 0 | 0 | |
17 | 0 | 0 | |
18 | 0 | 0 | |
19 | 0 | 0 | |
20 | 0 | 0 | |
21 | 0 | 0 | |
22 | 0 | 0 | |
23 | 0 | 0 |
(Go To: Top | General Summary | Monthly Report | Weekly Report | Daily Report | Daily Summary | Hourly Summary | Domain Report | Organization Report | Host Report | Status Code Report | File Size Report | File Type Report | Directory Report | Failure Report | Request Report)
This report lists the countries of the computers which requested files.
Listing domains, sorted by the amount of traffic.
#reqs | %bytes | domain |
---|---|---|
1 | 50.49% | .sa (Saudi Arabia) |
34 | 42.69% | .com (Commercial) |
3 | 6.82% | [unresolved numerical addresses] |
3 | .edu (US Higher Education) |
(Go To: Top | General Summary | Monthly Report | Weekly Report | Daily Report | Daily Summary | Hourly Summary | Domain Report | Organization Report | Host Report | Status Code Report | File Size Report | File Type Report | Directory Report | Failure Report | Request Report)
This report lists the organizations of the computers which requested files.
Listing organizations, sorted by the number of requests.
#reqs | %bytes | organization |
---|---|---|
15 | 29.94% | googlebot.com |
13 | 8.37% | cisco.com |
3 | 6.82% | 64.233 |
3 | uoregon.edu | |
3 | 2.12% | dir.com |
2 | 2.11% | inktomisearch.com |
1 | 50.49% | isu.net.sa |
1 | 0.15% | msn.com |
(Go To: Top | General Summary | Monthly Report | Weekly Report | Daily Report | Daily Summary | Hourly Summary | Domain Report | Organization Report | Host Report | Status Code Report | File Size Report | File Type Report | Directory Report | Failure Report | Request Report)
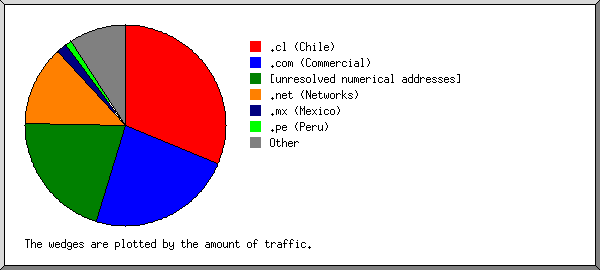
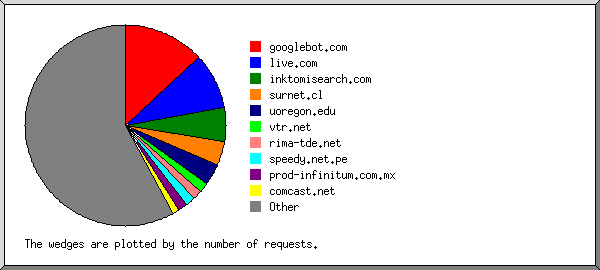
This report lists the computers which requested files.
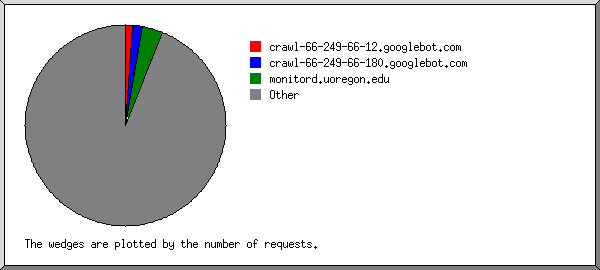
Listing hosts, sorted alphabetically.
#reqs | %bytes | host |
---|---|---|
2 | 4.55% | 64.233.166.136 |
1 | 2.27% | 64.233.178.136 |
13 | 8.37% | bxb-natpool-121.cisco.com |
3 | 2.12% | crawl26.dir.com |
1 | crawl-66-249-64-25.googlebot.com | |
1 | 2.99% | crawl-66-249-64-35.googlebot.com |
1 | 0.81% | crawl-66-249-64-42.googlebot.com |
1 | 0.97% | crawl-66-249-64-44.googlebot.com |
1 | 0.66% | crawl-66-249-64-47.googlebot.com |
2 | 19.76% | crawl-66-249-64-52.googlebot.com |
1 | 0.64% | crawl-66-249-64-6.googlebot.com |
1 | 0.63% | crawl-66-249-64-7.googlebot.com |
1 | 0.94% | crawl-66-249-71-1.googlebot.com |
1 | 0.63% | crawl-66-249-71-13.googlebot.com |
1 | 0.17% | crawl-66-249-71-69.googlebot.com |
1 | 0.81% | crawl-66-249-71-72.googlebot.com |
2 | 0.94% | crawl-66-249-71-73.googlebot.com |
1 | 0.82% | lj2362.inktomisearch.com |
1 | 1.29% | lj2476.inktomisearch.com |
1 | 0.15% | msnbot.msn.com |
3 | monitord.uoregon.edu | |
1 | 50.49% | cache6-1.ruh.isu.net.sa |
(Go To: Top | General Summary | Monthly Report | Weekly Report | Daily Report | Daily Summary | Hourly Summary | Domain Report | Organization Report | Host Report | Status Code Report | File Size Report | File Type Report | Directory Report | Failure Report | Request Report)
This report lists the HTTP status codes of all requests.
Listing status codes, sorted numerically.
#reqs | status code |
---|---|
39 | 200 OK |
1 | 206 Partial content |
1 | 301 Document moved permanently |
2 | 302 Document found elsewhere |
1 | 304 Not modified since last retrieval |
3 | 404 Document not found |
(Go To: Top | General Summary | Monthly Report | Weekly Report | Daily Report | Daily Summary | Hourly Summary | Domain Report | Organization Report | Host Report | Status Code Report | File Size Report | File Type Report | Directory Report | Failure Report | Request Report)
This report lists the sizes of files.
size | #reqs | %bytes |
---|---|---|
0 | 4 | |
1B- 10B | 0 | |
11B- 100B | 2 | 0.02% |
101B- 1kB | 8 | 0.71% |
1kB- 10kB | 19 | 13.07% |
10kB-100kB | 7 | 35.71% |
100kB- 1MB | 1 | 50.49% |
(Go To: Top | General Summary | Monthly Report | Weekly Report | Daily Report | Daily Summary | Hourly Summary | Domain Report | Organization Report | Host Report | Status Code Report | File Size Report | File Type Report | Directory Report | Failure Report | Request Report)
This report lists the extensions of files.
Listing extensions with at least 0.1% of the traffic, sorted by the amount of traffic.
#reqs | %bytes | extension |
---|---|---|
1 | 50.49% | .ppt |
2 | 19.76% | .gz [Gzip compressed files] |
2 | 19.76% | .ps.gz [Gzipped PostScript] |
12 | 15.48% | .html [Hypertext Markup Language] |
8 | 8.04% | [directories] |
6 | 4.78% | .php [PHP] |
10 | 1.09% | .gif [GIF graphics] |
1 | 0.20% | .ico |
1 | 0.15% | .htm [Hypertext Markup Language] |
(Go To: Top | General Summary | Monthly Report | Weekly Report | Daily Report | Daily Summary | Hourly Summary | Domain Report | Organization Report | Host Report | Status Code Report | File Size Report | File Type Report | Directory Report | Failure Report | Request Report)
This report lists the directories from which files were requested. (The figures for each directory include all of its subdirectories.)
Listing directories with at least 0.01% of the traffic, sorted by the amount of traffic.
#reqs | %bytes | directory |
---|---|---|
8 | 74.00% | /workshops/ |
12 | 13.79% | /archive/ |
1 | 6.14% | /calendar/ |
2 | 1.91% | /materials/ |
11 | 1.30% | /images/ |
2 | 1.27% | /scripts/ |
1 | 0.93% | /helpfiles/ |
1 | 0.66% | /planning/ |
3 | [not listed: 1 directory] |
(Go To: Top | General Summary | Monthly Report | Weekly Report | Daily Report | Daily Summary | Hourly Summary | Domain Report | Organization Report | Host Report | Status Code Report | File Size Report | File Type Report | Directory Report | Failure Report | Request Report)
This report lists the files that caused failures, for example files not found.
Listing files, sorted by the number of failed requests.
#reqs | file |
---|---|
1 | /robots.txt |
1 | /favicon.ico |
1 | /calendar/images/singlepix.gif |
(Go To: Top | General Summary | Monthly Report | Weekly Report | Daily Report | Daily Summary | Hourly Summary | Domain Report | Organization Report | Host Report | Status Code Report | File Size Report | File Type Report | Directory Report | Failure Report | Request Report)
This report lists the files on the site.
Listing files with at least 20 requests, sorted by the number of requests.
#reqs | %bytes | last time | file |
---|---|---|---|
41 | 100% | Dec/25/05 4:23 AM | [not listed: 35 files] |