Program started on Sun, Jun 21 2009 at 5:10 AM.
Analyzed requests from Sun, Jun 21 2009 at 4:57 AM to Sun, Jun 21 2009 at 5:10 AM (0.01 days).
(Go To: Top | General Summary | Monthly Report | Weekly Report | Daily Report | Daily Summary | Hourly Summary | Domain Report | Organization Report | Host Report | Status Code Report | File Size Report | File Type Report | Directory Report | Failure Report | Request Report)
This report contains overall statistics.
Successful requests: 28
Successful requests for pages: 15
Failed requests: 18
Distinct files requested: 28
Distinct hosts served: 14
Data transferred: 2.75 megabytes
(Go To: Top | General Summary | Monthly Report | Weekly Report | Daily Report | Daily Summary | Hourly Summary | Domain Report | Organization Report | Host Report | Status Code Report | File Size Report | File Type Report | Directory Report | Failure Report | Request Report)
This report lists the activity in each month.
Each unit () represents 1 request for a page.
month | #reqs | #pages | |
---|---|---|---|
Jun 2009 | 28 | 15 |
Busiest month: Jun 2009 (15 requests for pages).
(Go To: Top | General Summary | Monthly Report | Weekly Report | Daily Report | Daily Summary | Hourly Summary | Domain Report | Organization Report | Host Report | Status Code Report | File Size Report | File Type Report | Directory Report | Failure Report | Request Report)
This report lists the activity in each week.
Each unit () represents 1 request for a page.
week beg. | #reqs | #pages | |
---|---|---|---|
Jun/21/09 | 28 | 15 |
Busiest week: week beginning Jun/21/09 (15 requests for pages).
(Go To: Top | General Summary | Monthly Report | Weekly Report | Daily Report | Daily Summary | Hourly Summary | Domain Report | Organization Report | Host Report | Status Code Report | File Size Report | File Type Report | Directory Report | Failure Report | Request Report)
This report lists the activity in each day.
Each unit () represents 1 request for a page.
date | #reqs | #pages | |
---|---|---|---|
Jun/21/09 | 28 | 15 |
Busiest day: Jun/21/09 (15 requests for pages).
(Go To: Top | General Summary | Monthly Report | Weekly Report | Daily Report | Daily Summary | Hourly Summary | Domain Report | Organization Report | Host Report | Status Code Report | File Size Report | File Type Report | Directory Report | Failure Report | Request Report)
This report lists the total activity for each day of the week, summed over all the weeks in the report.
Each unit () represents 1 request for a page.
day | #reqs | #pages | |
---|---|---|---|
Sun | 28 | 15 | |
Mon | 0 | 0 | |
Tue | 0 | 0 | |
Wed | 0 | 0 | |
Thu | 0 | 0 | |
Fri | 0 | 0 | |
Sat | 0 | 0 |
(Go To: Top | General Summary | Monthly Report | Weekly Report | Daily Report | Daily Summary | Hourly Summary | Domain Report | Organization Report | Host Report | Status Code Report | File Size Report | File Type Report | Directory Report | Failure Report | Request Report)
This report lists the total activity for each hour of the day, summed over all the days in the report.
Each unit () represents 1 request for a page.
hour | #reqs | #pages | |
---|---|---|---|
0 | 0 | 0 | |
1 | 0 | 0 | |
2 | 0 | 0 | |
3 | 0 | 0 | |
4 | 7 | 4 | |
5 | 21 | 11 | |
6 | 0 | 0 | |
7 | 0 | 0 | |
8 | 0 | 0 | |
9 | 0 | 0 | |
10 | 0 | 0 | |
11 | 0 | 0 | |
12 | 0 | 0 | |
13 | 0 | 0 | |
14 | 0 | 0 | |
15 | 0 | 0 | |
16 | 0 | 0 | |
17 | 0 | 0 | |
18 | 0 | 0 | |
19 | 0 | 0 | |
20 | 0 | 0 | |
21 | 0 | 0 | |
22 | 0 | 0 | |
23 | 0 | 0 |
(Go To: Top | General Summary | Monthly Report | Weekly Report | Daily Report | Daily Summary | Hourly Summary | Domain Report | Organization Report | Host Report | Status Code Report | File Size Report | File Type Report | Directory Report | Failure Report | Request Report)
This report lists the countries of the computers which requested files.
Listing domains, sorted by the amount of traffic.
#reqs | %bytes | domain |
---|---|---|
19 | 76.11% | .com (Commercial) |
5 | 22.82% | .net (Networks) |
2 | 0.55% | .au (Australia) |
1 | 0.36% | .org (Non Profit Making Organizations) |
1 | 0.16% | [unresolved numerical addresses] |
(Go To: Top | General Summary | Monthly Report | Weekly Report | Daily Report | Daily Summary | Hourly Summary | Domain Report | Organization Report | Host Report | Status Code Report | File Size Report | File Type Report | Directory Report | Failure Report | Request Report)
This report lists the organizations of the computers which requested files.
Listing organizations, sorted by the number of requests.
#reqs | %bytes | organization |
---|---|---|
10 | 37.60% | googlebot.com |
9 | 38.51% | msn.com |
4 | 8.36% | yahoo.net |
2 | 0.55% | optusnet.com.au |
1 | 14.45% | zayoms.net |
1 | 0.16% | 65.55 |
1 | 0.36% | nsrc.org |
(Go To: Top | General Summary | Monthly Report | Weekly Report | Daily Report | Daily Summary | Hourly Summary | Domain Report | Organization Report | Host Report | Status Code Report | File Size Report | File Type Report | Directory Report | Failure Report | Request Report)
This report lists the computers which requested files.
Listing hosts, sorted alphabetically.
#reqs | %bytes | host |
---|---|---|
1 | 0.16% | 65.55.231.29 |
2 | 0.55% | c211-28-50-88.dandn2.vic.optusnet.com.au |
1 | crawl-66-249-68-103.googlebot.com | |
9 | 37.60% | crawl-66-249-68-132.googlebot.com |
2 | 29.79% | msnbot-65-55-106-117.search.msn.com |
1 | 0.17% | msnbot-65-55-106-157.search.msn.com |
1 | 6.94% | msnbot-65-55-106-184.search.msn.com |
1 | 0.55% | msnbot-65-55-108-171.search.msn.com |
1 | msnbot-65-55-210-73.search.msn.com | |
1 | 1.06% | msnbot-65-55-210-78.search.msn.com |
2 | msnbot-65-55-210-79.search.msn.com | |
4 | 8.36% | llf531131.crawl.yahoo.net |
1 | 14.45% | 69-147-144-98.ftwyin.zayoms.net |
1 | 0.36% | nsrc.org |
(Go To: Top | General Summary | Monthly Report | Weekly Report | Daily Report | Daily Summary | Hourly Summary | Domain Report | Organization Report | Host Report | Status Code Report | File Size Report | File Type Report | Directory Report | Failure Report | Request Report)
This report lists the HTTP status codes of all requests.
Listing status codes, sorted numerically.
#reqs | status code |
---|---|
21 | 200 OK |
7 | 304 Not modified since last retrieval |
18 | 404 Document not found |
(Go To: Top | General Summary | Monthly Report | Weekly Report | Daily Report | Daily Summary | Hourly Summary | Domain Report | Organization Report | Host Report | Status Code Report | File Size Report | File Type Report | Directory Report | Failure Report | Request Report)
This report lists the sizes of files.
size | #reqs | %bytes |
---|---|---|
0 | 7 | |
1B- 10B | 0 | |
11B- 100B | 0 | |
101B- 1kB | 0 | |
1kB- 10kB | 11 | 0.95% |
10kB-100kB | 5 | 4.13% |
100kB- 1MB | 5 | 94.92% |
(Go To: Top | General Summary | Monthly Report | Weekly Report | Daily Report | Daily Summary | Hourly Summary | Domain Report | Organization Report | Host Report | Status Code Report | File Size Report | File Type Report | Directory Report | Failure Report | Request Report)
This report lists the extensions of files.
Listing extensions with at least 0.1% of the traffic, sorted by the amount of traffic.
#reqs | %bytes | extension |
---|---|---|
2 | 36.73% | .ppt |
1 | 35.48% | .php [PHP] |
2 | 14.45% | .txt [Plain text] |
1 | 8.26% | .pdf [Adobe Portable Document Format] |
2 | 2.77% | .sxi |
11 | 0.89% | [directories] |
1 | 0.55% | .jpeg [JPEG graphics] |
4 | 0.46% | .html [Hypertext Markup Language] |
1 | 0.17% | .pl [Perl scripts] |
2 | 0.16% | .jpg [JPEG graphics] |
1 | 0.09% | [not listed: 1 extension] |
(Go To: Top | General Summary | Monthly Report | Weekly Report | Daily Report | Daily Summary | Hourly Summary | Domain Report | Organization Report | Host Report | Status Code Report | File Size Report | File Type Report | Directory Report | Failure Report | Request Report)
This report lists the directories from which files were requested. (The figures for each directory include all of its subdirectories.)
Listing directories with at least 0.01% of the traffic, sorted by the amount of traffic.
#reqs | %bytes | directory |
---|---|---|
4 | 59.44% | /data/ |
1 | 35.48% | /materials/ |
20 | 4.55% | /workshops/ |
1 | 0.36% | [root directory] |
1 | 0.17% | /cgi-bin/ |
1 | [not listed: 1 directory] |
(Go To: Top | General Summary | Monthly Report | Weekly Report | Daily Report | Daily Summary | Hourly Summary | Domain Report | Organization Report | Host Report | Status Code Report | File Size Report | File Type Report | Directory Report | Failure Report | Request Report)
This report lists the files that caused failures, for example files not found.
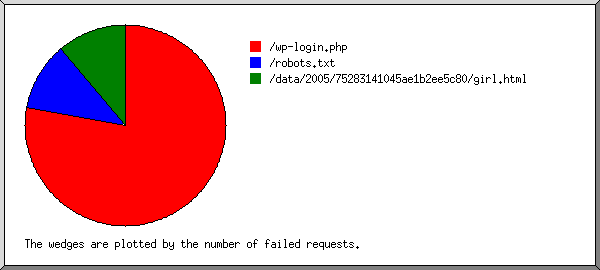
Listing files, sorted by the number of failed requests.
#reqs | file |
---|---|
2 | /robots.txt |
1 | /http://galera.pt/log.txt |
1 | /data/2005/8135015745dc6b408947b/men.html |
1 | /data/2005/8135015745dc6b408947b/boob.html |
1 | /calendar/http://galera.pt/log.txt |
1 | /data/2005/8135015745dc6b408947b/xxx.html |
1 | /data/2005/8135015745dc6b408947b/milf.html |
1 | /data/2005/8135015745dc6b408947b/slut.html |
1 | /data/2005/8135015745dc6b408947b/blow.html |
1 | /favicon.ico |
1 | /data/2005/8135015745dc6b408947b/dick.html |
1 | /data/2005/8135015745dc6b408947b/anal.html |
1 | /data/2005/8135015745dc6b408947b/nudes.html |
1 | /data/2005/8135015745dc6b408947b/butt.html |
1 | /data/2005/8135015745dc6b408947b/gay.html |
1 | /data/2005/8135015745dc6b408947b/fuck.html |
1 | /data/2005/8135015745dc6b408947b/nude.html |
(Go To: Top | General Summary | Monthly Report | Weekly Report | Daily Report | Daily Summary | Hourly Summary | Domain Report | Organization Report | Host Report | Status Code Report | File Size Report | File Type Report | Directory Report | Failure Report | Request Report)
This report lists the files on the site.
Listing files with at least 20 requests, sorted by the number of requests.
#reqs | %bytes | last time | file |
---|---|---|---|
28 | 100% | Jun/21/09 5:09 AM | [not listed: 24 files] |