Web Server Statistics for ISOC Workshop Resource Centre

Program started on Sun, Sep 06 2009 at 5:10 AM.
Analyzed requests from Sun, Sep 06 2009 at 4:55 AM to Sun, Sep 06 2009 at 5:09 AM (0.01 days).

General Summary

(Go To: Top | General Summary | Monthly Report | Weekly Report | Daily Report | Daily Summary | Hourly Summary | Domain Report | Organization Report | Host Report | Status Code Report | File Size Report | File Type Report | Directory Report | Failure Report | Request Report)

This report contains overall statistics.

Successful requests: 42
Successful requests for pages: 20
Failed requests: 6
Distinct files requested: 35
Distinct hosts served: 24
Data transferred: 5.04 megabytes

Monthly Report

(Go To: Top | General Summary | Monthly Report | Weekly Report | Daily Report | Daily Summary | Hourly Summary | Domain Report | Organization Report | Host Report | Status Code Report | File Size Report | File Type Report | Directory Report | Failure Report | Request Report)

This report lists the activity in each month.

Each unit (+) represents 1 request for a page.

month#reqs#pages 
Sep 20094220++++++++++++++++++++

Busiest month: Sep 2009 (20 requests for pages).

Weekly Report

(Go To: Top | General Summary | Monthly Report | Weekly Report | Daily Report | Daily Summary | Hourly Summary | Domain Report | Organization Report | Host Report | Status Code Report | File Size Report | File Type Report | Directory Report | Failure Report | Request Report)

This report lists the activity in each week.

Each unit (+) represents 1 request for a page.

week beg.#reqs#pages 
Sep/ 6/094220++++++++++++++++++++

Busiest week: week beginning Sep/ 6/09 (20 requests for pages).

Daily Report

(Go To: Top | General Summary | Monthly Report | Weekly Report | Daily Report | Daily Summary | Hourly Summary | Domain Report | Organization Report | Host Report | Status Code Report | File Size Report | File Type Report | Directory Report | Failure Report | Request Report)

This report lists the activity in each day.

Each unit (+) represents 1 request for a page.

date#reqs#pages 
Sep/ 6/094220++++++++++++++++++++

Busiest day: Sep/ 6/09 (20 requests for pages).

Daily Summary

(Go To: Top | General Summary | Monthly Report | Weekly Report | Daily Report | Daily Summary | Hourly Summary | Domain Report | Organization Report | Host Report | Status Code Report | File Size Report | File Type Report | Directory Report | Failure Report | Request Report)

This report lists the total activity for each day of the week, summed over all the weeks in the report.

Each unit (+) represents 1 request for a page.

day#reqs#pages 
Sun4220++++++++++++++++++++
Mon00
Tue00
Wed00
Thu00
Fri00
Sat00

Hourly Summary

(Go To: Top | General Summary | Monthly Report | Weekly Report | Daily Report | Daily Summary | Hourly Summary | Domain Report | Organization Report | Host Report | Status Code Report | File Size Report | File Type Report | Directory Report | Failure Report | Request Report)

This report lists the total activity for each hour of the day, summed over all the days in the report.

Each unit (+) represents 1 request for a page.

hour#reqs#pages 
000
100
200
300
42110++++++++++
52110++++++++++
600
700
800
900
1000
1100
1200
1300
1400
1500
1600
1700
1800
1900
2000
2100
2200
2300

Domain Report

(Go To: Top | General Summary | Monthly Report | Weekly Report | Daily Report | Daily Summary | Hourly Summary | Domain Report | Organization Report | Host Report | Status Code Report | File Size Report | File Type Report | Directory Report | Failure Report | Request Report)

This report lists the countries of the computers which requested files.

Listing domains, sorted by the amount of traffic.

#reqs%bytesdomain
975.46%.net (Networks)
916.48%[unresolved numerical addresses]
1 6.06%.mx (Mexico)
20 1.12%.com (Commercial)
1 0.48%.nl (Netherlands)
2 0.40%.org (Non Profit Making Organizations)

Organization Report

(Go To: Top | General Summary | Monthly Report | Weekly Report | Daily Report | Daily Summary | Hourly Summary | Domain Report | Organization Report | Host Report | Status Code Report | File Size Report | File Type Report | Directory Report | Failure Report | Request Report)

This report lists the organizations of the computers which requested files.

Listing organizations, sorted by the number of requests.

#reqs%bytesorganization
16 0.23%msn.com
510.48%194.8
4 7.71%yahoo.net
4 0.89%googlebot.com
3 1.79%tedata.net
265.95%rima-tde.net
2 0.40%nsrc.org
1 0.12%190.152
1 0.04%65.55
1 6.06%cybercable.net.mx
1 0.20%41
1 0.48%rodecker.nl
1 5.65%117

Host Report

(Go To: Top | General Summary | Monthly Report | Weekly Report | Daily Report | Daily Summary | Hourly Summary | Domain Report | Organization Report | Host Report | Status Code Report | File Size Report | File Type Report | Directory Report | Failure Report | Request Report)

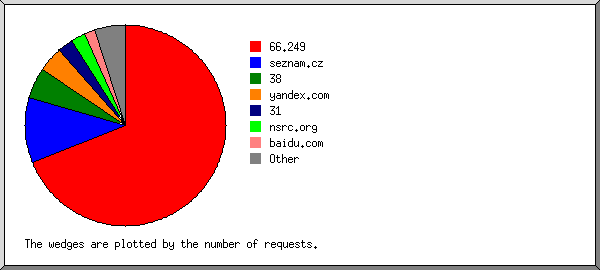
This report lists the computers which requested files.

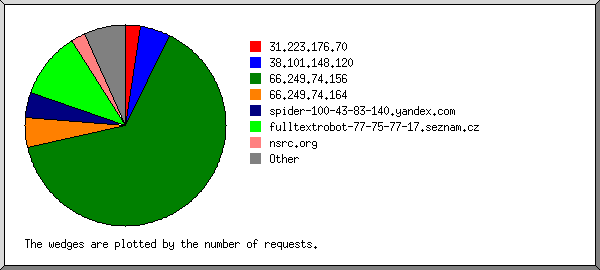
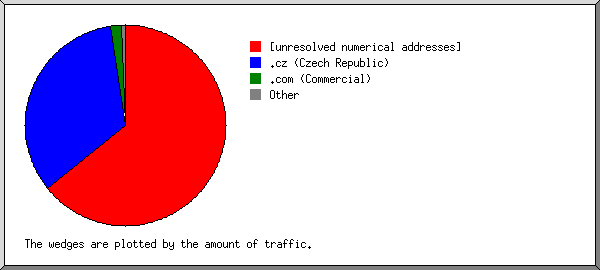
Listing hosts, sorted alphabetically.

#reqs%byteshost
1 0.20%41.189.96.7
1 0.04%65.55.230.230
1 5.65%117.200.4.70
1 0.12%190.152.116.188
510.48%194.8.75.159
4 0.89%crawl-66-249-68-22.googlebot.com
1 msnbot-65-55-106-108.search.msn.com
1 msnbot-65-55-106-113.search.msn.com
1 msnbot-65-55-106-114.search.msn.com
1 msnbot-65-55-106-156.search.msn.com
1 0.09%msnbot-65-55-106-158.search.msn.com
1 msnbot-65-55-106-203.search.msn.com
1 msnbot-65-55-106-230.search.msn.com
1 msnbot-65-55-106-235.search.msn.com
1 msnbot-65-55-210-69.search.msn.com
4 msnbot-65-55-210-70.search.msn.com
2 0.03%msnbot-65-55-210-78.search.msn.com
1 0.10%msnbot-65-55-37-194.search.msn.com
1 6.06%201-130-247-164-cable.cybercable.net.mx
265.95%137.red-79-147-14.dynamicip.rima-tde.net
3 1.79%host-41.233.47.80.tedata.net
4 7.71%llf531069.crawl.yahoo.net
1 0.48%nienna.rodecker.nl
2 0.40%nsrc.org

Status Code Report

(Go To: Top | General Summary | Monthly Report | Weekly Report | Daily Report | Daily Summary | Hourly Summary | Domain Report | Organization Report | Host Report | Status Code Report | File Size Report | File Type Report | Directory Report | Failure Report | Request Report)

This report lists the HTTP status codes of all requests.

Listing status codes, sorted numerically.

#reqsstatus code
24200 OK
3206 Partial content
15304 Not modified since last retrieval
6404 Document not found

File Size Report

(Go To: Top | General Summary | Monthly Report | Weekly Report | Daily Report | Daily Summary | Hourly Summary | Domain Report | Organization Report | Host Report | Status Code Report | File Size Report | File Type Report | Directory Report | Failure Report | Request Report)

This report lists the sizes of files.

size#reqs%bytes
015 
1B- 10B0 
11B- 100B0 
101B- 1kB1 0.02%
1kB- 10kB7 0.45%
10kB-100kB13 5.62%
100kB- 1MB427.95%
1MB- 10MB265.95%

File Type Report

(Go To: Top | General Summary | Monthly Report | Weekly Report | Daily Report | Daily Summary | Hourly Summary | Domain Report | Organization Report | Host Report | Status Code Report | File Size Report | File Type Report | Directory Report | Failure Report | Request Report)

This report lists the extensions of files.

Listing extensions with at least 0.1% of the traffic, sorted by the amount of traffic.

#reqs%bytesextension
673.40%.pdf [Adobe Portable Document Format]
417.10%.ppt
1 6.06%.doc [Microsoft Word document]
11 1.10%.html [Hypertext Markup Language]
9 0.91%[directories]
3 0.62%.php [PHP]
1 0.48%.ics
1 0.12%.gif [GIF graphics]
2 0.10%.jpeg [JPEG graphics]
4 0.09%[not listed: 4 extensions]

Directory Report

(Go To: Top | General Summary | Monthly Report | Weekly Report | Daily Report | Daily Summary | Hourly Summary | Domain Report | Organization Report | Host Report | Status Code Report | File Size Report | File Type Report | Directory Report | Failure Report | Request Report)

This report lists the directories from which files were requested. (The figures for each directory include all of its subdirectories.)

Listing directories with at least 0.01% of the traffic, sorted by the amount of traffic.

#reqs%bytesdirectory
679.05%/data/
1817.86%/workshops/
6 1.19%[root directory]
6 1.07%/analog/
1 0.48%/calendar/
1 0.23%/helpfiles/
1 0.09%/cgi-bin/
1 0.03%/mailman/
2 [not listed: 2 directories]

Failure Report

(Go To: Top | General Summary | Monthly Report | Weekly Report | Daily Report | Daily Summary | Hourly Summary | Domain Report | Organization Report | Host Report | Status Code Report | File Size Report | File Type Report | Directory Report | Failure Report | Request Report)

This report lists the files that caused failures, for example files not found.

Listing files, sorted by the number of failed requests.

#reqsfile
2/favicon.ico
2/helpfiles/index.php
1/robots.txt
1/workshops/2008/cctld-ams/Infrastructure/Documentation/DNSSEC_Key_maintenance.pdf

Request Report

(Go To: Top | General Summary | Monthly Report | Weekly Report | Daily Report | Daily Summary | Hourly Summary | Domain Report | Organization Report | Host Report | Status Code Report | File Size Report | File Type Report | Directory Report | Failure Report | Request Report)

This report lists the files on the site.

Listing files with at least 20 requests, sorted by the number of requests.

#reqs%byteslast timefile
42100%Sep/ 6/09 5:09 AM[not listed: 35 files]