Program started on Sun, Dec 06 2009 at 5:10 AM.
Analyzed requests from Sun, Dec 06 2009 at 4:56 AM to Sun, Dec 06 2009 at 5:09 AM (0.01 days).
(Go To: Top | General Summary | Monthly Report | Weekly Report | Daily Report | Daily Summary | Hourly Summary | Domain Report | Organization Report | Host Report | Status Code Report | File Size Report | File Type Report | Directory Report | Failure Report | Request Report)
This report contains overall statistics.
Successful requests: 57
Successful requests for pages: 36
Failed requests: 2
Distinct files requested: 51
Distinct hosts served: 27
Data transferred: 1.53 megabytes
(Go To: Top | General Summary | Monthly Report | Weekly Report | Daily Report | Daily Summary | Hourly Summary | Domain Report | Organization Report | Host Report | Status Code Report | File Size Report | File Type Report | Directory Report | Failure Report | Request Report)
This report lists the activity in each month.
Each unit () represents 1 request for a page.
month | #reqs | #pages | |
---|---|---|---|
Dec 2009 | 57 | 36 |
Busiest month: Dec 2009 (36 requests for pages).
(Go To: Top | General Summary | Monthly Report | Weekly Report | Daily Report | Daily Summary | Hourly Summary | Domain Report | Organization Report | Host Report | Status Code Report | File Size Report | File Type Report | Directory Report | Failure Report | Request Report)
This report lists the activity in each week.
Each unit () represents 1 request for a page.
week beg. | #reqs | #pages | |
---|---|---|---|
Dec/ 6/09 | 57 | 36 |
Busiest week: week beginning Dec/ 6/09 (36 requests for pages).
(Go To: Top | General Summary | Monthly Report | Weekly Report | Daily Report | Daily Summary | Hourly Summary | Domain Report | Organization Report | Host Report | Status Code Report | File Size Report | File Type Report | Directory Report | Failure Report | Request Report)
This report lists the activity in each day.
Each unit () represents 1 request for a page.
date | #reqs | #pages | |
---|---|---|---|
Dec/ 6/09 | 57 | 36 |
Busiest day: Dec/ 6/09 (36 requests for pages).
(Go To: Top | General Summary | Monthly Report | Weekly Report | Daily Report | Daily Summary | Hourly Summary | Domain Report | Organization Report | Host Report | Status Code Report | File Size Report | File Type Report | Directory Report | Failure Report | Request Report)
This report lists the total activity for each day of the week, summed over all the weeks in the report.
Each unit () represents 1 request for a page.
day | #reqs | #pages | |
---|---|---|---|
Sun | 57 | 36 | |
Mon | 0 | 0 | |
Tue | 0 | 0 | |
Wed | 0 | 0 | |
Thu | 0 | 0 | |
Fri | 0 | 0 | |
Sat | 0 | 0 |
(Go To: Top | General Summary | Monthly Report | Weekly Report | Daily Report | Daily Summary | Hourly Summary | Domain Report | Organization Report | Host Report | Status Code Report | File Size Report | File Type Report | Directory Report | Failure Report | Request Report)
This report lists the total activity for each hour of the day, summed over all the days in the report.
Each unit () represents 1 request for a page.
hour | #reqs | #pages | |
---|---|---|---|
0 | 0 | 0 | |
1 | 0 | 0 | |
2 | 0 | 0 | |
3 | 0 | 0 | |
4 | 15 | 8 | |
5 | 42 | 28 | |
6 | 0 | 0 | |
7 | 0 | 0 | |
8 | 0 | 0 | |
9 | 0 | 0 | |
10 | 0 | 0 | |
11 | 0 | 0 | |
12 | 0 | 0 | |
13 | 0 | 0 | |
14 | 0 | 0 | |
15 | 0 | 0 | |
16 | 0 | 0 | |
17 | 0 | 0 | |
18 | 0 | 0 | |
19 | 0 | 0 | |
20 | 0 | 0 | |
21 | 0 | 0 | |
22 | 0 | 0 | |
23 | 0 | 0 |
(Go To: Top | General Summary | Monthly Report | Weekly Report | Daily Report | Daily Summary | Hourly Summary | Domain Report | Organization Report | Host Report | Status Code Report | File Size Report | File Type Report | Directory Report | Failure Report | Request Report)
This report lists the countries of the computers which requested files.
Listing domains, sorted by the amount of traffic.
#reqs | %bytes | domain |
---|---|---|
32 | 53.30% | .com (Commercial) |
18 | 20.10% | .net (Networks) |
2 | 13.94% | [unresolved numerical addresses] |
1 | 7.30% | .jp (Japan) |
1 | 2.35% | .ru (Russia) |
1 | 1.70% | .nl (Netherlands) |
1 | 0.66% | .org (Non Profit Making Organizations) |
1 | 0.66% | .cz (Czech Republic) |
(Go To: Top | General Summary | Monthly Report | Weekly Report | Daily Report | Daily Summary | Hourly Summary | Domain Report | Organization Report | Host Report | Status Code Report | File Size Report | File Type Report | Directory Report | Failure Report | Request Report)
This report lists the organizations of the computers which requested files.
Listing organizations, sorted by the number of requests.
#reqs | %bytes | organization |
---|---|---|
18 | 1.65% | msn.com |
13 | 25.72% | googlebot.com |
11 | 16.03% | yahoo.net |
6 | 3.93% | verizon.net |
1 | 0.21% | 65.55 |
1 | 0.66% | axton.cz |
1 | 13.72% | 122 |
1 | 1.70% | rodecker.nl |
1 | 25.93% | axefrog.com |
1 | 7.30% | ocn.ne.jp |
1 | 0.66% | nsrc.org |
1 | 2.35% | yandex.ru |
1 | 0.14% | comcast.net |
(Go To: Top | General Summary | Monthly Report | Weekly Report | Daily Report | Daily Summary | Hourly Summary | Domain Report | Organization Report | Host Report | Status Code Report | File Size Report | File Type Report | Directory Report | Failure Report | Request Report)
This report lists the computers which requested files.
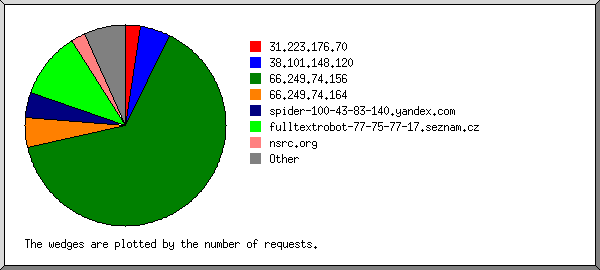
Listing hosts, sorted alphabetically.
#reqs | %bytes | host |
---|---|---|
1 | 0.21% | 65.55.230.230 |
1 | 13.72% | 122.101.136.9 |
1 | 25.93% | mail.axefrog.com |
13 | 25.72% | crawl-66-249-68-51.googlebot.com |
1 | msnbot-65-55-106-135.search.msn.com | |
1 | msnbot-65-55-106-136.search.msn.com | |
1 | 0.24% | msnbot-65-55-106-180.search.msn.com |
1 | 0.14% | msnbot-65-55-106-187.search.msn.com |
1 | 0.06% | msnbot-65-55-106-206.search.msn.com |
1 | msnbot-65-55-106-229.search.msn.com | |
1 | msnbot-65-55-107-179.search.msn.com | |
2 | 0.56% | msnbot-65-55-207-134.search.msn.com |
1 | 0.58% | msnbot-65-55-207-138.search.msn.com |
1 | msnbot-65-55-207-25.search.msn.com | |
1 | msnbot-65-55-207-28.search.msn.com | |
1 | 0.07% | msnbot-65-55-207-54.search.msn.com |
2 | msnbot-65-55-207-72.search.msn.com | |
2 | msnbot-65-55-207-75.search.msn.com | |
1 | msnbot-65-55-207-96.search.msn.com | |
1 | 0.66% | server1.axton.cz |
1 | 7.30% | p2067-ipbf305akatuka.ibaraki.ocn.ne.jp |
1 | 0.14% | c-67-160-237-24.hsd1.ca.comcast.net |
6 | 3.93% | pool-71-246-50-28.lsanca.fios.verizon.net |
11 | 16.03% | b3090925.crawl.yahoo.net |
1 | 1.70% | nienna.rodecker.nl |
1 | 0.66% | nsrc.org |
1 | 2.35% | spider12.yandex.ru |
(Go To: Top | General Summary | Monthly Report | Weekly Report | Daily Report | Daily Summary | Hourly Summary | Domain Report | Organization Report | Host Report | Status Code Report | File Size Report | File Type Report | Directory Report | Failure Report | Request Report)
This report lists the HTTP status codes of all requests.
Listing status codes, sorted numerically.
#reqs | status code |
---|---|
42 | 200 OK |
15 | 304 Not modified since last retrieval |
2 | 404 Document not found |
(Go To: Top | General Summary | Monthly Report | Weekly Report | Daily Report | Daily Summary | Hourly Summary | Domain Report | Organization Report | Host Report | Status Code Report | File Size Report | File Type Report | Directory Report | Failure Report | Request Report)
This report lists the sizes of files.
size | #reqs | %bytes |
---|---|---|
0 | 15 | |
1B- 10B | 0 | |
11B- 100B | 0 | |
101B- 1kB | 0 | |
1kB- 10kB | 15 | 3.86% |
10kB-100kB | 23 | 42.69% |
100kB- 1MB | 4 | 53.45% |
(Go To: Top | General Summary | Monthly Report | Weekly Report | Daily Report | Daily Summary | Hourly Summary | Domain Report | Organization Report | Host Report | Status Code Report | File Size Report | File Type Report | Directory Report | Failure Report | Request Report)
This report lists the extensions of files.
Listing extensions with at least 0.1% of the traffic, sorted by the amount of traffic.
#reqs | %bytes | extension |
---|---|---|
4 | 33.58% | .txt [Plain text] |
19 | 26.15% | .html [Hypertext Markup Language] |
4 | 16.28% | .pdf [Adobe Portable Document Format] |
1 | 6.49% | .doc [Microsoft Word document] |
15 | 6.15% | [directories] |
6 | 5.39% | .php [PHP] |
1 | 2.35% | .sxi |
1 | 1.70% | .ics |
1 | 1.56% | .gz [Gzip compressed files] |
1 | 1.56% | .ps.gz [Gzipped PostScript] |
1 | 0.24% | .pl [Perl scripts] |
2 | 0.10% | .htm [Hypertext Markup Language] |
2 | [not listed: 2 extensions] |
(Go To: Top | General Summary | Monthly Report | Weekly Report | Daily Report | Daily Summary | Hourly Summary | Domain Report | Organization Report | Host Report | Status Code Report | File Size Report | File Type Report | Directory Report | Failure Report | Request Report)
This report lists the directories from which files were requested. (The figures for each directory include all of its subdirectories.)
Listing directories with at least 0.01% of the traffic, sorted by the amount of traffic.
#reqs | %bytes | directory |
---|---|---|
5 | 42.57% | /data/ |
10 | 26.02% | /analog/ |
25 | 18.77% | /workshops/ |
8 | 5.25% | [root directory] |
2 | 4.27% | /calendar/ |
4 | 2.43% | /helpfiles/ |
1 | 0.38% | /mailing/ |
1 | 0.24% | /cgi-bin/ |
1 | 0.07% | /organizers/ |
(Go To: Top | General Summary | Monthly Report | Weekly Report | Daily Report | Daily Summary | Hourly Summary | Domain Report | Organization Report | Host Report | Status Code Report | File Size Report | File Type Report | Directory Report | Failure Report | Request Report)
This report lists the files that caused failures, for example files not found.
Listing files, sorted by the number of failed requests.
#reqs | file |
---|---|
1 | /favicon.ico |
1 | /data/2005/8135015745dc6b408947b/galleries.html |
(Go To: Top | General Summary | Monthly Report | Weekly Report | Daily Report | Daily Summary | Hourly Summary | Domain Report | Organization Report | Host Report | Status Code Report | File Size Report | File Type Report | Directory Report | Failure Report | Request Report)
This report lists the files on the site.
Listing files with at least 20 requests, sorted by the number of requests.
#reqs | %bytes | last time | file |
---|---|---|---|
57 | 100% | Dec/ 6/09 5:09 AM | [not listed: 47 files] |